Indian (Asian) vs Immigrants from Vietnam Unemployment Among Ages 30 to 34 years
COMPARE
Indian (Asian)
Immigrants from Vietnam
Unemployment Among Ages 30 to 34 years
Unemployment Among Ages 30 to 34 years Comparison
Indians (Asian)
Immigrants from Vietnam
5.1%
UNEMPLOYMENT AMONG AGES 30 TO 34 YEARS
97.0/ 100
METRIC RATING
61st/ 347
METRIC RANK
5.0%
UNEMPLOYMENT AMONG AGES 30 TO 34 YEARS
98.9/ 100
METRIC RATING
40th/ 347
METRIC RANK
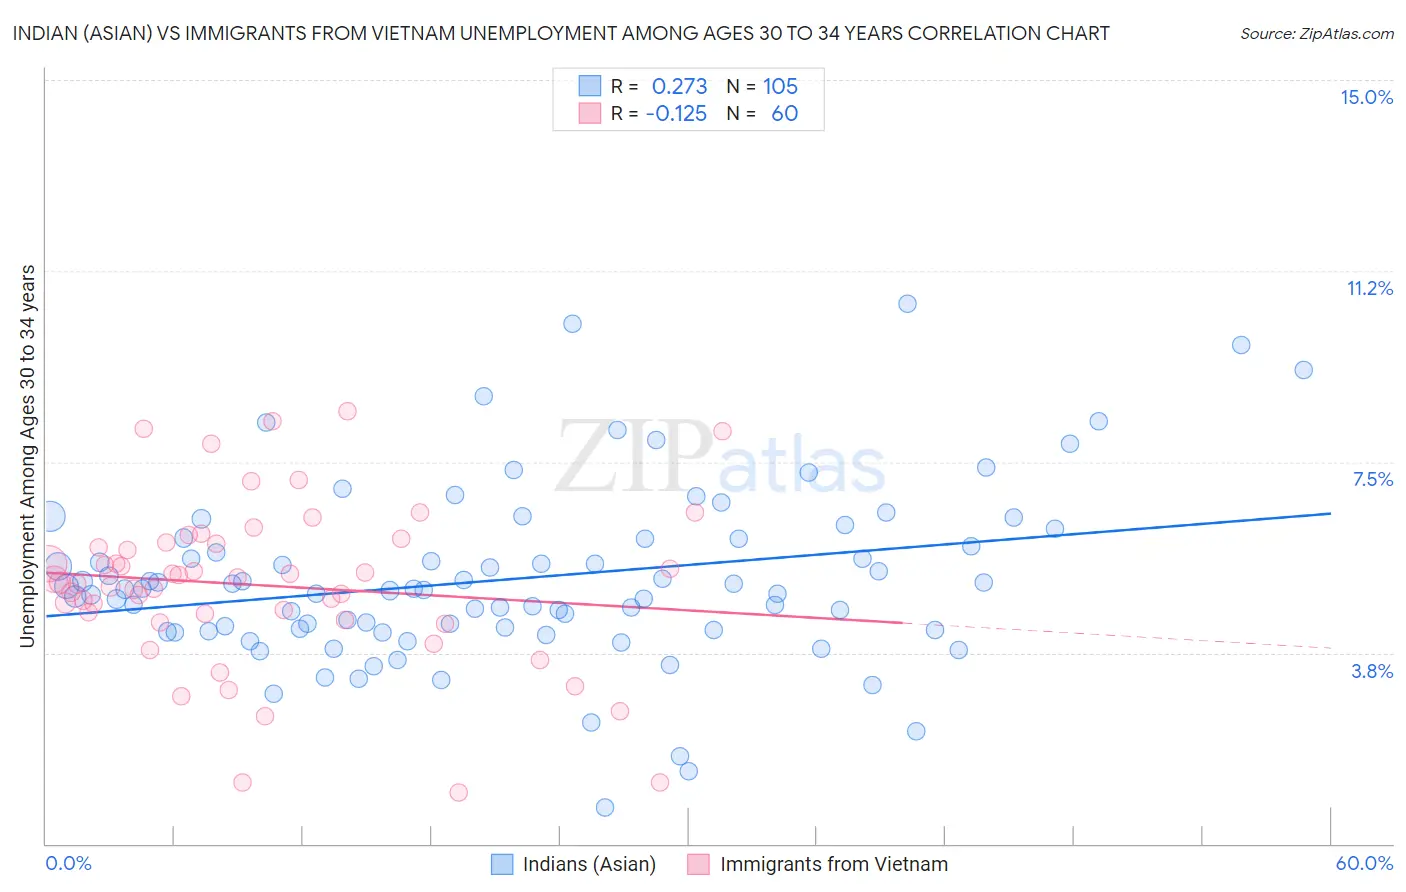
Indian (Asian) vs Immigrants from Vietnam Unemployment Among Ages 30 to 34 years Correlation Chart
The statistical analysis conducted on geographies consisting of 455,312,622 people shows a weak positive correlation between the proportion of Indians (Asian) and unemployment rate among population between the ages 30 and 34 in the United States with a correlation coefficient (R) of 0.273 and weighted average of 5.1%. Similarly, the statistical analysis conducted on geographies consisting of 383,818,102 people shows a poor negative correlation between the proportion of Immigrants from Vietnam and unemployment rate among population between the ages 30 and 34 in the United States with a correlation coefficient (R) of -0.125 and weighted average of 5.0%, a difference of 2.0%.
Unemployment Among Ages 30 to 34 years Correlation Summary
| Measurement | Indian (Asian) | Immigrants from Vietnam |
| Minimum | 0.70% | 1.0% |
| Maximum | 10.6% | 8.5% |
| Range | 9.9% | 7.5% |
| Mean | 5.2% | 5.1% |
| Median | 5.0% | 5.2% |
| Interquartile 25% (IQ1) | 4.2% | 4.5% |
| Interquartile 75% (IQ3) | 6.0% | 5.9% |
| Interquartile Range (IQR) | 1.8% | 1.4% |
| Standard Deviation (Sample) | 1.7% | 1.6% |
| Standard Deviation (Population) | 1.7% | 1.6% |
Similar Demographics by Unemployment Among Ages 30 to 34 years
Demographics Similar to Indians (Asian) by Unemployment Among Ages 30 to 34 years
In terms of unemployment among ages 30 to 34 years, the demographic groups most similar to Indians (Asian) are Immigrants from France (5.1%, a difference of 0.020%), Swedish (5.1%, a difference of 0.030%), Immigrants from Somalia (5.1%, a difference of 0.030%), Belgian (5.1%, a difference of 0.030%), and Immigrants from Eastern Asia (5.1%, a difference of 0.050%).
| Demographics | Rating | Rank | Unemployment Among Ages 30 to 34 years |
| Immigrants | Morocco | 97.9 /100 | #54 | Exceptional 5.1% |
| Chinese | 97.7 /100 | #55 | Exceptional 5.1% |
| Immigrants | Serbia | 97.4 /100 | #56 | Exceptional 5.1% |
| Immigrants | China | 97.2 /100 | #57 | Exceptional 5.1% |
| Asians | 97.2 /100 | #58 | Exceptional 5.1% |
| Swedes | 97.1 /100 | #59 | Exceptional 5.1% |
| Immigrants | Somalia | 97.1 /100 | #60 | Exceptional 5.1% |
| Indians (Asian) | 97.0 /100 | #61 | Exceptional 5.1% |
| Immigrants | France | 97.0 /100 | #62 | Exceptional 5.1% |
| Belgians | 97.0 /100 | #63 | Exceptional 5.1% |
| Immigrants | Eastern Asia | 96.9 /100 | #64 | Exceptional 5.1% |
| Immigrants | Japan | 96.8 /100 | #65 | Exceptional 5.1% |
| Immigrants | Zimbabwe | 96.7 /100 | #66 | Exceptional 5.1% |
| Burmese | 96.5 /100 | #67 | Exceptional 5.1% |
| Jordanians | 96.5 /100 | #68 | Exceptional 5.1% |
Demographics Similar to Immigrants from Vietnam by Unemployment Among Ages 30 to 34 years
In terms of unemployment among ages 30 to 34 years, the demographic groups most similar to Immigrants from Vietnam are Immigrants from Eastern Africa (5.0%, a difference of 0.0%), Fijian (5.0%, a difference of 0.080%), Sri Lankan (5.0%, a difference of 0.18%), Immigrants from Hong Kong (5.0%, a difference of 0.18%), and Immigrants from Turkey (5.0%, a difference of 0.19%).
| Demographics | Rating | Rank | Unemployment Among Ages 30 to 34 years |
| Immigrants | Saudi Arabia | 99.3 /100 | #33 | Exceptional 5.0% |
| Latvians | 99.3 /100 | #34 | Exceptional 5.0% |
| Immigrants | Ethiopia | 99.2 /100 | #35 | Exceptional 5.0% |
| Czechs | 99.2 /100 | #36 | Exceptional 5.0% |
| Immigrants | Turkey | 99.0 /100 | #37 | Exceptional 5.0% |
| Sri Lankans | 99.0 /100 | #38 | Exceptional 5.0% |
| Fijians | 99.0 /100 | #39 | Exceptional 5.0% |
| Immigrants | Vietnam | 98.9 /100 | #40 | Exceptional 5.0% |
| Immigrants | Eastern Africa | 98.9 /100 | #41 | Exceptional 5.0% |
| Immigrants | Hong Kong | 98.8 /100 | #42 | Exceptional 5.0% |
| Soviet Union | 98.8 /100 | #43 | Exceptional 5.0% |
| Immigrants | Belgium | 98.7 /100 | #44 | Exceptional 5.1% |
| Yugoslavians | 98.6 /100 | #45 | Exceptional 5.1% |
| Immigrants | Congo | 98.4 /100 | #46 | Exceptional 5.1% |
| Cypriots | 98.4 /100 | #47 | Exceptional 5.1% |