Immigrants vs Slovak Family Households
COMPARE
Immigrants
Slovak
Family Households
Family Households Comparison
Immigrants
Slovaks
66.1%
FAMILY HOUSEHOLDS
100.0/ 100
METRIC RATING
55th/ 347
METRIC RANK
63.3%
FAMILY HOUSEHOLDS
1.0/ 100
METRIC RATING
254th/ 347
METRIC RANK
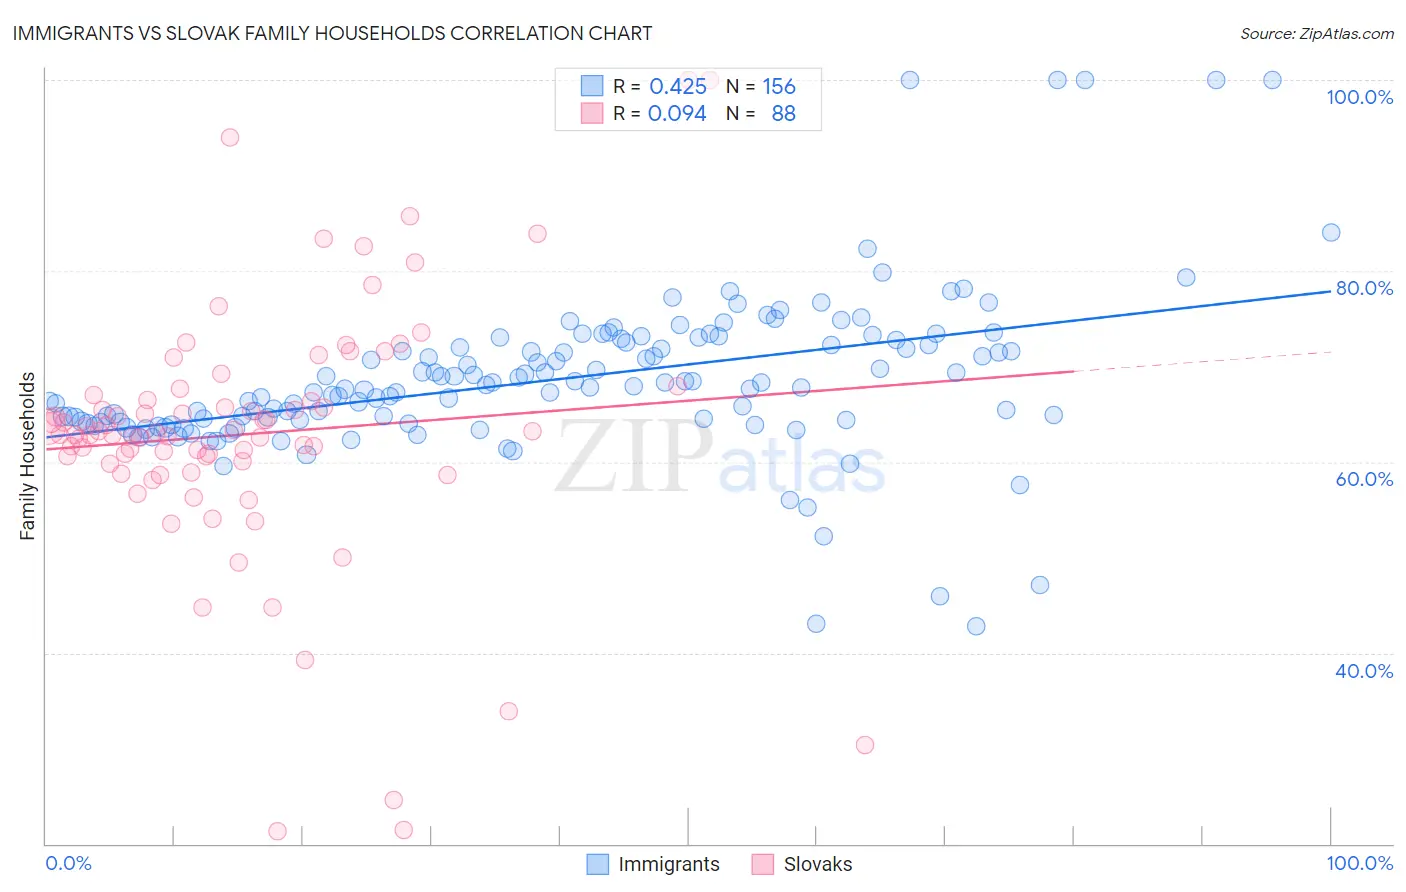
Immigrants vs Slovak Family Households Correlation Chart
The statistical analysis conducted on geographies consisting of 577,097,366 people shows a moderate positive correlation between the proportion of Immigrants and percentage of family households in the United States with a correlation coefficient (R) of 0.425 and weighted average of 66.1%. Similarly, the statistical analysis conducted on geographies consisting of 397,683,029 people shows a slight positive correlation between the proportion of Slovaks and percentage of family households in the United States with a correlation coefficient (R) of 0.094 and weighted average of 63.3%, a difference of 4.5%.
Family Households Correlation Summary
| Measurement | Immigrants | Slovak |
| Minimum | 42.8% | 21.3% |
| Maximum | 100.0% | 100.0% |
| Range | 57.2% | 78.7% |
| Mean | 68.6% | 62.9% |
| Median | 67.8% | 63.0% |
| Interquartile 25% (IQ1) | 64.2% | 59.9% |
| Interquartile 75% (IQ3) | 72.4% | 66.7% |
| Interquartile Range (IQR) | 8.2% | 6.8% |
| Standard Deviation (Sample) | 8.6% | 13.6% |
| Standard Deviation (Population) | 8.5% | 13.5% |
Similar Demographics by Family Households
Demographics Similar to Immigrants by Family Households
In terms of family households, the demographic groups most similar to Immigrants are Immigrants from Hong Kong (66.1%, a difference of 0.010%), Pennsylvania German (66.1%, a difference of 0.030%), Immigrants from Asia (66.1%, a difference of 0.14%), Immigrants from Korea (66.0%, a difference of 0.15%), and South American (66.0%, a difference of 0.16%).
| Demographics | Rating | Rank | Family Households |
| Immigrants | Venezuela | 100.0 /100 | #48 | Exceptional 66.4% |
| Immigrants | South Central Asia | 100.0 /100 | #49 | Exceptional 66.4% |
| Navajo | 100.0 /100 | #50 | Exceptional 66.4% |
| Natives/Alaskans | 100.0 /100 | #51 | Exceptional 66.4% |
| Colombians | 100.0 /100 | #52 | Exceptional 66.3% |
| Afghans | 100.0 /100 | #53 | Exceptional 66.3% |
| Immigrants | Colombia | 100.0 /100 | #54 | Exceptional 66.3% |
| Immigrants | Immigrants | 100.0 /100 | #55 | Exceptional 66.1% |
| Immigrants | Hong Kong | 100.0 /100 | #56 | Exceptional 66.1% |
| Pennsylvania Germans | 100.0 /100 | #57 | Exceptional 66.1% |
| Immigrants | Asia | 100.0 /100 | #58 | Exceptional 66.1% |
| Immigrants | Korea | 100.0 /100 | #59 | Exceptional 66.0% |
| South Americans | 100.0 /100 | #60 | Exceptional 66.0% |
| Danes | 100.0 /100 | #61 | Exceptional 66.0% |
| Central Americans | 100.0 /100 | #62 | Exceptional 66.0% |
Demographics Similar to Slovaks by Family Households
In terms of family households, the demographic groups most similar to Slovaks are Immigrants from Dominican Republic (63.3%, a difference of 0.010%), Potawatomi (63.3%, a difference of 0.020%), Bahamian (63.3%, a difference of 0.030%), Taiwanese (63.3%, a difference of 0.040%), and Luxembourger (63.3%, a difference of 0.050%).
| Demographics | Rating | Rank | Family Households |
| Immigrants | Uzbekistan | 1.5 /100 | #247 | Tragic 63.4% |
| Dominicans | 1.5 /100 | #248 | Tragic 63.4% |
| Russians | 1.4 /100 | #249 | Tragic 63.4% |
| Immigrants | Japan | 1.4 /100 | #250 | Tragic 63.4% |
| Taiwanese | 1.2 /100 | #251 | Tragic 63.3% |
| Bahamians | 1.1 /100 | #252 | Tragic 63.3% |
| Immigrants | Dominican Republic | 1.0 /100 | #253 | Tragic 63.3% |
| Slovaks | 1.0 /100 | #254 | Tragic 63.3% |
| Potawatomi | 1.0 /100 | #255 | Tragic 63.3% |
| Luxembourgers | 0.9 /100 | #256 | Tragic 63.3% |
| Icelanders | 0.8 /100 | #257 | Tragic 63.3% |
| Immigrants | Barbados | 0.7 /100 | #258 | Tragic 63.2% |
| Immigrants | Western Europe | 0.6 /100 | #259 | Tragic 63.2% |
| Cypriots | 0.6 /100 | #260 | Tragic 63.2% |
| Immigrants | Russia | 0.6 /100 | #261 | Tragic 63.2% |