Immigrants from Kazakhstan vs Slovak Family Households
COMPARE
Immigrants from Kazakhstan
Slovak
Family Households
Family Households Comparison
Immigrants from Kazakhstan
Slovaks
63.1%
FAMILY HOUSEHOLDS
0.3/ 100
METRIC RATING
273rd/ 347
METRIC RANK
63.3%
FAMILY HOUSEHOLDS
1.0/ 100
METRIC RATING
254th/ 347
METRIC RANK
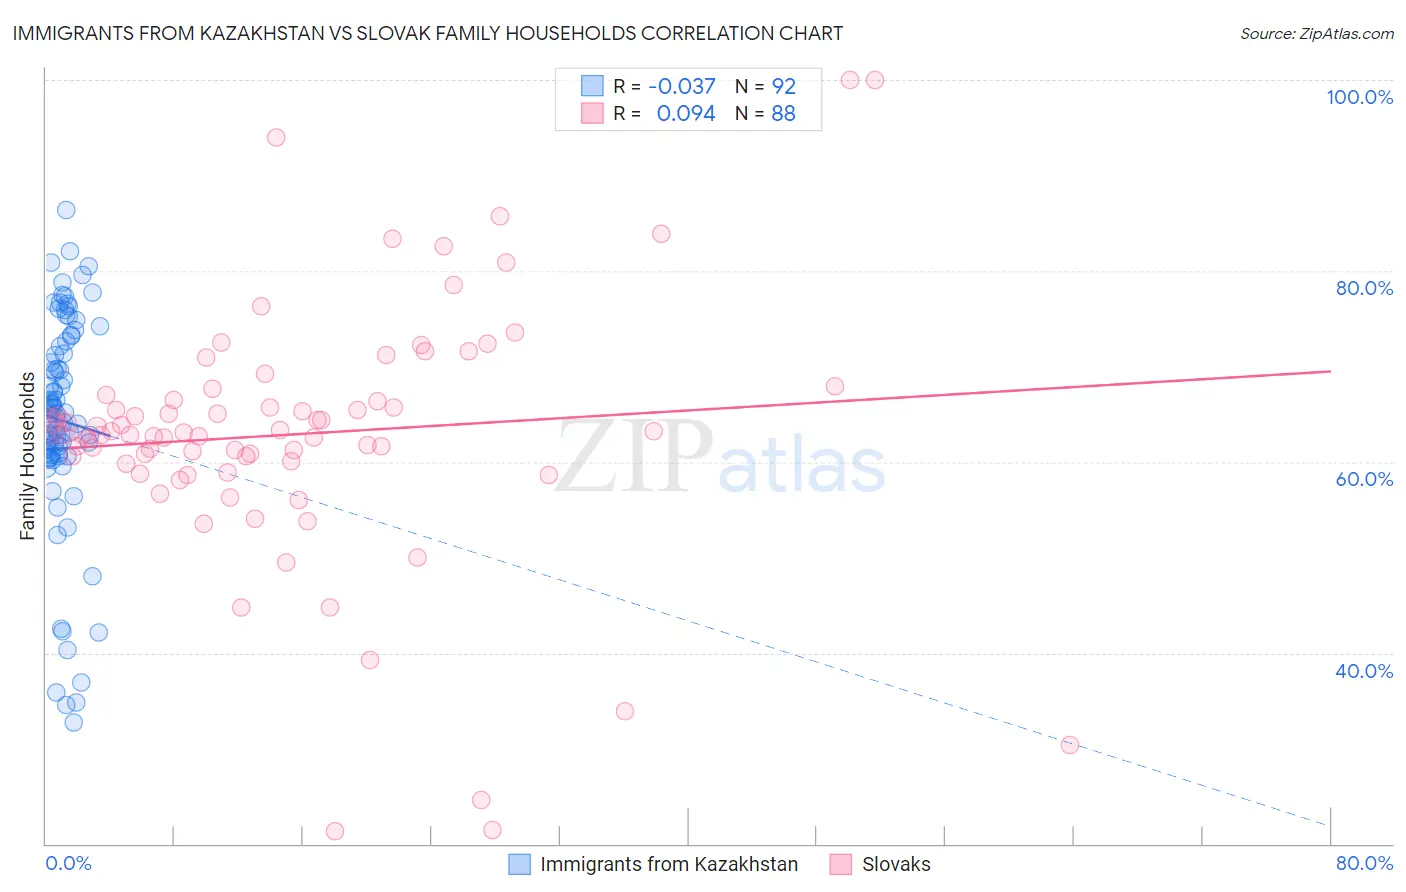
Immigrants from Kazakhstan vs Slovak Family Households Correlation Chart
The statistical analysis conducted on geographies consisting of 124,429,118 people shows no correlation between the proportion of Immigrants from Kazakhstan and percentage of family households in the United States with a correlation coefficient (R) of -0.037 and weighted average of 63.1%. Similarly, the statistical analysis conducted on geographies consisting of 397,683,029 people shows a slight positive correlation between the proportion of Slovaks and percentage of family households in the United States with a correlation coefficient (R) of 0.094 and weighted average of 63.3%, a difference of 0.40%.
Family Households Correlation Summary
| Measurement | Immigrants from Kazakhstan | Slovak |
| Minimum | 32.8% | 21.3% |
| Maximum | 86.3% | 100.0% |
| Range | 53.6% | 78.7% |
| Mean | 64.3% | 62.9% |
| Median | 65.0% | 63.0% |
| Interquartile 25% (IQ1) | 60.7% | 59.9% |
| Interquartile 75% (IQ3) | 72.3% | 66.7% |
| Interquartile Range (IQR) | 11.7% | 6.8% |
| Standard Deviation (Sample) | 11.3% | 13.6% |
| Standard Deviation (Population) | 11.3% | 13.5% |
Demographics Similar to Immigrants from Kazakhstan and Slovaks by Family Households
In terms of family households, the demographic groups most similar to Immigrants from Kazakhstan are Immigrants from Croatia (63.1%, a difference of 0.010%), Immigrants from Turkey (63.1%, a difference of 0.010%), Immigrants from Austria (63.1%, a difference of 0.020%), Immigrants from Singapore (63.1%, a difference of 0.040%), and Yugoslavian (63.1%, a difference of 0.040%). Similarly, the demographic groups most similar to Slovaks are Immigrants from Dominican Republic (63.3%, a difference of 0.010%), Potawatomi (63.3%, a difference of 0.020%), Luxembourger (63.3%, a difference of 0.050%), Icelander (63.3%, a difference of 0.090%), and Immigrants from Barbados (63.2%, a difference of 0.15%).
| Demographics | Rating | Rank | Family Households |
| Immigrants | Dominican Republic | 1.0 /100 | #253 | Tragic 63.3% |
| Slovaks | 1.0 /100 | #254 | Tragic 63.3% |
| Potawatomi | 1.0 /100 | #255 | Tragic 63.3% |
| Luxembourgers | 0.9 /100 | #256 | Tragic 63.3% |
| Icelanders | 0.8 /100 | #257 | Tragic 63.3% |
| Immigrants | Barbados | 0.7 /100 | #258 | Tragic 63.2% |
| Immigrants | Western Europe | 0.6 /100 | #259 | Tragic 63.2% |
| Cypriots | 0.6 /100 | #260 | Tragic 63.2% |
| Immigrants | Russia | 0.6 /100 | #261 | Tragic 63.2% |
| Immigrants | Ireland | 0.6 /100 | #262 | Tragic 63.2% |
| Cheyenne | 0.5 /100 | #263 | Tragic 63.2% |
| Kenyans | 0.5 /100 | #264 | Tragic 63.2% |
| Colville | 0.5 /100 | #265 | Tragic 63.2% |
| Immigrants | Western Africa | 0.5 /100 | #266 | Tragic 63.1% |
| Israelis | 0.4 /100 | #267 | Tragic 63.1% |
| Immigrants | Singapore | 0.4 /100 | #268 | Tragic 63.1% |
| Yugoslavians | 0.4 /100 | #269 | Tragic 63.1% |
| Immigrants | Austria | 0.3 /100 | #270 | Tragic 63.1% |
| Immigrants | Croatia | 0.3 /100 | #271 | Tragic 63.1% |
| Immigrants | Turkey | 0.3 /100 | #272 | Tragic 63.1% |
| Immigrants | Kazakhstan | 0.3 /100 | #273 | Tragic 63.1% |