Immigrants vs Jordanian Single Mother Households
COMPARE
Immigrants
Jordanian
Single Mother Households
Single Mother Households Comparison
Immigrants
Jordanians
6.8%
SINGLE MOTHER HOUSEHOLDS
4.3/ 100
METRIC RATING
219th/ 347
METRIC RANK
6.0%
SINGLE MOTHER HOUSEHOLDS
88.9/ 100
METRIC RATING
136th/ 347
METRIC RANK
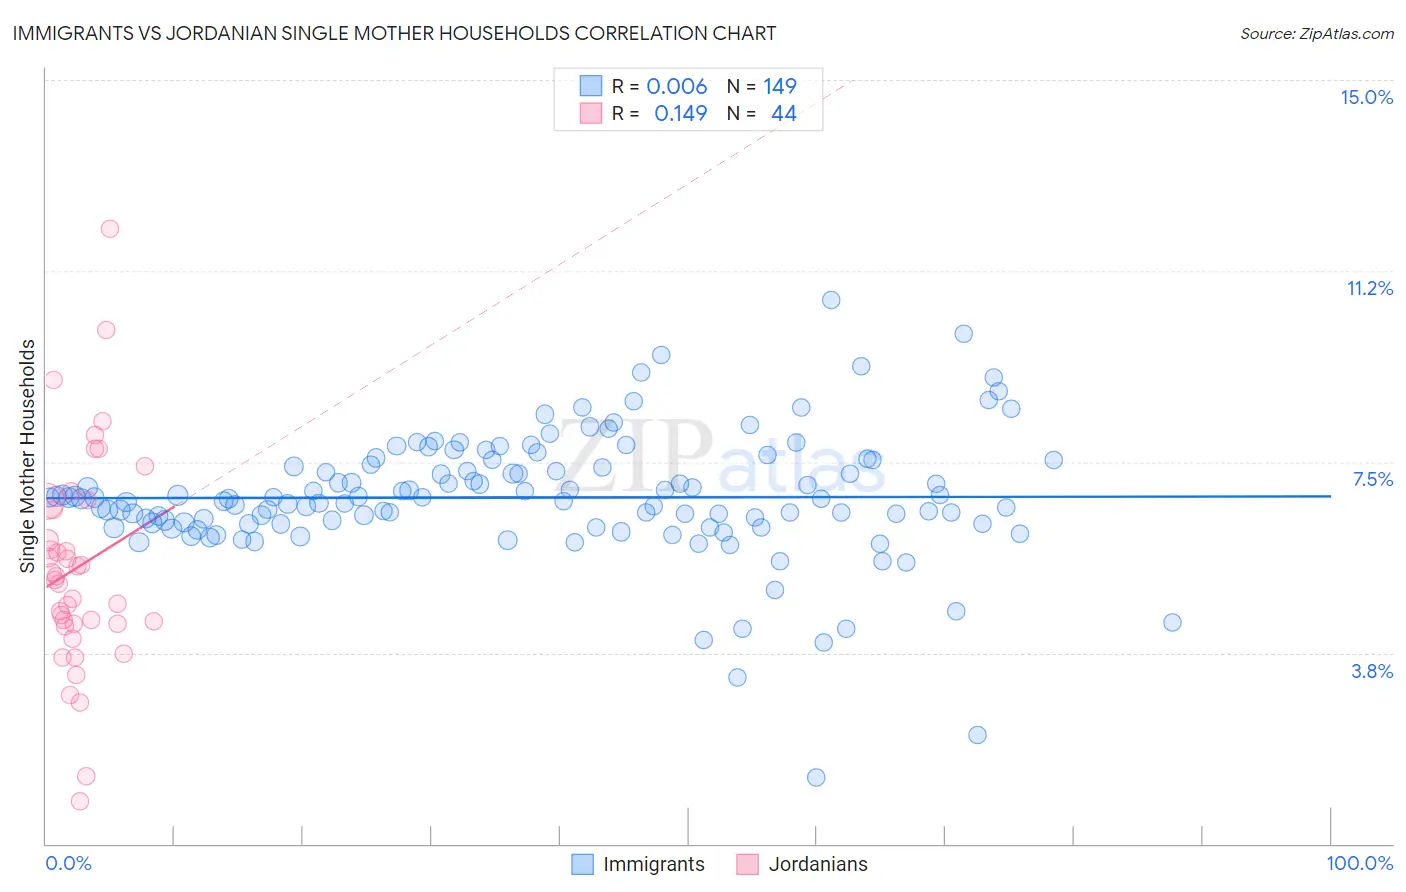
Immigrants vs Jordanian Single Mother Households Correlation Chart
The statistical analysis conducted on geographies consisting of 572,041,298 people shows no correlation between the proportion of Immigrants and percentage of single mother households in the United States with a correlation coefficient (R) of 0.006 and weighted average of 6.8%. Similarly, the statistical analysis conducted on geographies consisting of 166,276,124 people shows a poor positive correlation between the proportion of Jordanians and percentage of single mother households in the United States with a correlation coefficient (R) of 0.149 and weighted average of 6.0%, a difference of 15.0%.
Single Mother Households Correlation Summary
| Measurement | Immigrants | Jordanian |
| Minimum | 1.3% | 0.84% |
| Maximum | 10.7% | 12.1% |
| Range | 9.4% | 11.2% |
| Mean | 6.8% | 5.4% |
| Median | 6.8% | 5.2% |
| Interquartile 25% (IQ1) | 6.3% | 4.3% |
| Interquartile 75% (IQ3) | 7.4% | 6.6% |
| Interquartile Range (IQR) | 1.1% | 2.3% |
| Standard Deviation (Sample) | 1.3% | 2.1% |
| Standard Deviation (Population) | 1.3% | 2.1% |
Similar Demographics by Single Mother Households
Demographics Similar to Immigrants by Single Mother Households
In terms of single mother households, the demographic groups most similar to Immigrants are Immigrants from Eastern Africa (6.8%, a difference of 0.090%), Immigrants from Thailand (6.9%, a difference of 0.18%), Aleut (6.8%, a difference of 0.30%), French American Indian (6.9%, a difference of 0.38%), and Immigrants from Bangladesh (6.9%, a difference of 0.40%).
| Demographics | Rating | Rank | Single Mother Households |
| Immigrants | Eritrea | 8.4 /100 | #212 | Tragic 6.7% |
| Immigrants | Costa Rica | 8.2 /100 | #213 | Tragic 6.7% |
| Immigrants | Uruguay | 7.9 /100 | #214 | Tragic 6.7% |
| Shoshone | 5.7 /100 | #215 | Tragic 6.8% |
| Cherokee | 5.1 /100 | #216 | Tragic 6.8% |
| Aleuts | 4.8 /100 | #217 | Tragic 6.8% |
| Immigrants | Eastern Africa | 4.4 /100 | #218 | Tragic 6.8% |
| Immigrants | Immigrants | 4.3 /100 | #219 | Tragic 6.8% |
| Immigrants | Thailand | 4.0 /100 | #220 | Tragic 6.9% |
| French American Indians | 3.7 /100 | #221 | Tragic 6.9% |
| Immigrants | Bangladesh | 3.7 /100 | #222 | Tragic 6.9% |
| Immigrants | Micronesia | 3.6 /100 | #223 | Tragic 6.9% |
| Immigrants | Sudan | 3.5 /100 | #224 | Tragic 6.9% |
| Sudanese | 3.1 /100 | #225 | Tragic 6.9% |
| Paiute | 2.4 /100 | #226 | Tragic 7.0% |
Demographics Similar to Jordanians by Single Mother Households
In terms of single mother households, the demographic groups most similar to Jordanians are Immigrants from Pakistan (6.0%, a difference of 0.13%), Immigrants from Saudi Arabia (5.9%, a difference of 0.42%), Canadian (5.9%, a difference of 0.51%), Icelander (6.0%, a difference of 0.53%), and Egyptian (5.9%, a difference of 0.57%).
| Demographics | Rating | Rank | Single Mother Households |
| Immigrants | Bolivia | 92.2 /100 | #129 | Exceptional 5.9% |
| Palestinians | 92.1 /100 | #130 | Exceptional 5.9% |
| Immigrants | Spain | 91.2 /100 | #131 | Exceptional 5.9% |
| Albanians | 91.1 /100 | #132 | Exceptional 5.9% |
| Egyptians | 90.7 /100 | #133 | Exceptional 5.9% |
| Canadians | 90.5 /100 | #134 | Exceptional 5.9% |
| Immigrants | Saudi Arabia | 90.2 /100 | #135 | Exceptional 5.9% |
| Jordanians | 88.9 /100 | #136 | Excellent 6.0% |
| Immigrants | Pakistan | 88.4 /100 | #137 | Excellent 6.0% |
| Icelanders | 86.9 /100 | #138 | Excellent 6.0% |
| Syrians | 86.0 /100 | #139 | Excellent 6.0% |
| French | 85.7 /100 | #140 | Excellent 6.0% |
| Tsimshian | 85.2 /100 | #141 | Excellent 6.0% |
| Immigrants | Egypt | 85.0 /100 | #142 | Excellent 6.0% |
| Immigrants | Iraq | 84.8 /100 | #143 | Excellent 6.0% |