Immigrants from Serbia vs Immigrants from India Family Households
COMPARE
Immigrants from Serbia
Immigrants from India
Family Households
Family Households Comparison
Immigrants from Serbia
Immigrants from India
61.6%
FAMILY HOUSEHOLDS
0.0/ 100
METRIC RATING
322nd/ 347
METRIC RANK
67.4%
FAMILY HOUSEHOLDS
100.0/ 100
METRIC RATING
26th/ 347
METRIC RANK
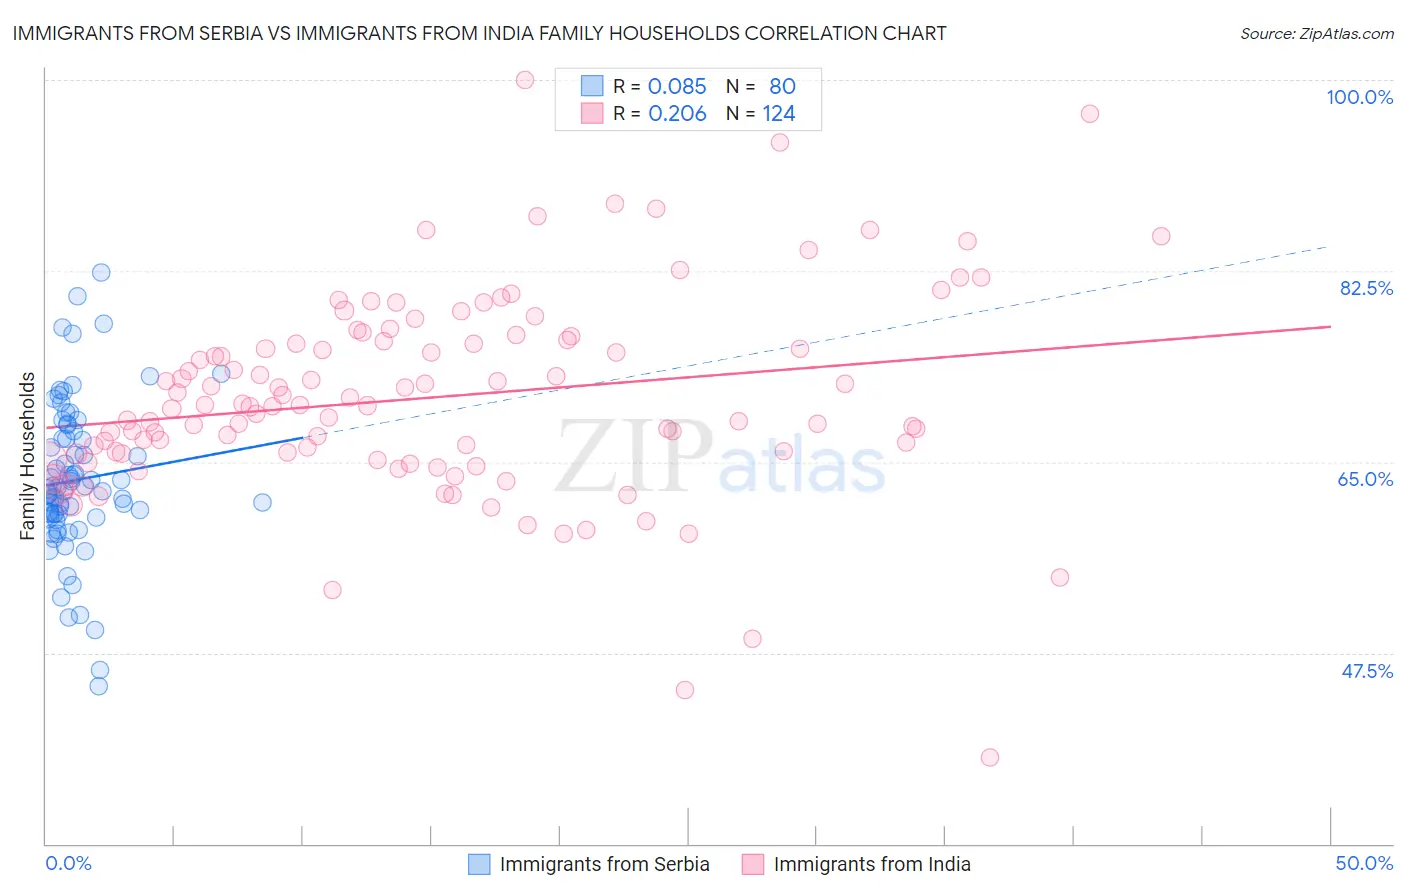
Immigrants from Serbia vs Immigrants from India Family Households Correlation Chart
The statistical analysis conducted on geographies consisting of 131,724,151 people shows a slight positive correlation between the proportion of Immigrants from Serbia and percentage of family households in the United States with a correlation coefficient (R) of 0.085 and weighted average of 61.6%. Similarly, the statistical analysis conducted on geographies consisting of 433,768,337 people shows a weak positive correlation between the proportion of Immigrants from India and percentage of family households in the United States with a correlation coefficient (R) of 0.206 and weighted average of 67.4%, a difference of 9.5%.
Family Households Correlation Summary
| Measurement | Immigrants from Serbia | Immigrants from India |
| Minimum | 44.5% | 37.9% |
| Maximum | 82.3% | 100.0% |
| Range | 37.8% | 62.1% |
| Mean | 63.4% | 70.9% |
| Median | 62.6% | 70.2% |
| Interquartile 25% (IQ1) | 60.2% | 65.7% |
| Interquartile 75% (IQ3) | 67.5% | 76.1% |
| Interquartile Range (IQR) | 7.3% | 10.4% |
| Standard Deviation (Sample) | 7.0% | 9.4% |
| Standard Deviation (Population) | 7.0% | 9.4% |
Similar Demographics by Family Households
Demographics Similar to Immigrants from Serbia by Family Households
In terms of family households, the demographic groups most similar to Immigrants from Serbia are Tlingit-Haida (61.6%, a difference of 0.010%), Immigrants from West Indies (61.6%, a difference of 0.010%), Immigrants from Switzerland (61.6%, a difference of 0.020%), Alsatian (61.7%, a difference of 0.090%), and Ugandan (61.7%, a difference of 0.14%).
| Demographics | Rating | Rank | Family Households |
| Moroccans | 0.0 /100 | #315 | Tragic 61.9% |
| Immigrants | Middle Africa | 0.0 /100 | #316 | Tragic 61.9% |
| Immigrants | Bosnia and Herzegovina | 0.0 /100 | #317 | Tragic 61.9% |
| Alaskan Athabascans | 0.0 /100 | #318 | Tragic 61.8% |
| Cape Verdeans | 0.0 /100 | #319 | Tragic 61.8% |
| Ugandans | 0.0 /100 | #320 | Tragic 61.7% |
| Alsatians | 0.0 /100 | #321 | Tragic 61.7% |
| Immigrants | Serbia | 0.0 /100 | #322 | Tragic 61.6% |
| Tlingit-Haida | 0.0 /100 | #323 | Tragic 61.6% |
| Immigrants | West Indies | 0.0 /100 | #324 | Tragic 61.6% |
| Immigrants | Switzerland | 0.0 /100 | #325 | Tragic 61.6% |
| Indonesians | 0.0 /100 | #326 | Tragic 61.5% |
| Blacks/African Americans | 0.0 /100 | #327 | Tragic 61.5% |
| Kiowa | 0.0 /100 | #328 | Tragic 61.4% |
| Cambodians | 0.0 /100 | #329 | Tragic 61.4% |
Demographics Similar to Immigrants from India by Family Households
In terms of family households, the demographic groups most similar to Immigrants from India are Immigrants from Nicaragua (67.5%, a difference of 0.010%), Immigrants from South Eastern Asia (67.5%, a difference of 0.040%), Hispanic or Latino (67.4%, a difference of 0.040%), Hawaiian (67.4%, a difference of 0.060%), and Nicaraguan (67.4%, a difference of 0.13%).
| Demographics | Rating | Rank | Family Households |
| Samoans | 100.0 /100 | #19 | Exceptional 67.9% |
| Inupiat | 100.0 /100 | #20 | Exceptional 67.8% |
| Cubans | 100.0 /100 | #21 | Exceptional 67.7% |
| Sri Lankans | 100.0 /100 | #22 | Exceptional 67.7% |
| Immigrants | Pakistan | 100.0 /100 | #23 | Exceptional 67.7% |
| Immigrants | South Eastern Asia | 100.0 /100 | #24 | Exceptional 67.5% |
| Immigrants | Nicaragua | 100.0 /100 | #25 | Exceptional 67.5% |
| Immigrants | India | 100.0 /100 | #26 | Exceptional 67.4% |
| Hispanics or Latinos | 100.0 /100 | #27 | Exceptional 67.4% |
| Hawaiians | 100.0 /100 | #28 | Exceptional 67.4% |
| Nicaraguans | 100.0 /100 | #29 | Exceptional 67.4% |
| Immigrants | Peru | 100.0 /100 | #30 | Exceptional 67.2% |
| Immigrants | Latin America | 100.0 /100 | #31 | Exceptional 67.2% |
| Nepalese | 100.0 /100 | #32 | Exceptional 67.2% |
| Salvadorans | 100.0 /100 | #33 | Exceptional 67.2% |