Immigrants from West Indies vs White/Caucasian Disability Age 35 to 64
COMPARE
Immigrants from West Indies
White/Caucasian
Disability Age 35 to 64
Disability Age 35 to 64 Comparison
Immigrants from West Indies
Whites/Caucasians
11.8%
DISABILITY AGE 35 TO 64
8.9/ 100
METRIC RATING
220th/ 347
METRIC RANK
12.6%
DISABILITY AGE 35 TO 64
0.3/ 100
METRIC RATING
266th/ 347
METRIC RANK
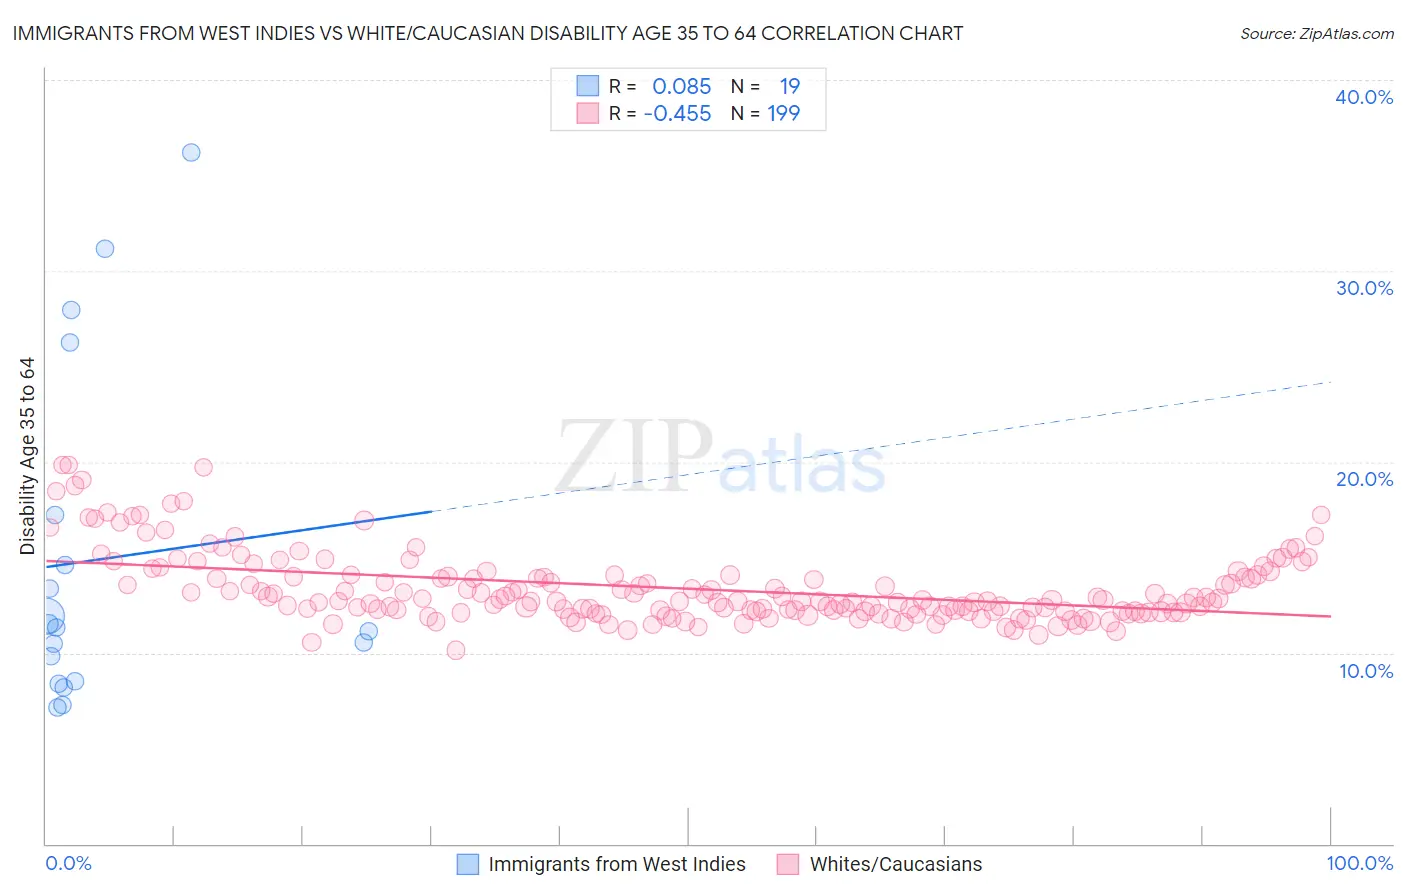
Immigrants from West Indies vs White/Caucasian Disability Age 35 to 64 Correlation Chart
The statistical analysis conducted on geographies consisting of 72,454,628 people shows a slight positive correlation between the proportion of Immigrants from West Indies and percentage of population with a disability between the ages 34 and 64 in the United States with a correlation coefficient (R) of 0.085 and weighted average of 11.8%. Similarly, the statistical analysis conducted on geographies consisting of 582,010,909 people shows a moderate negative correlation between the proportion of Whites/Caucasians and percentage of population with a disability between the ages 34 and 64 in the United States with a correlation coefficient (R) of -0.455 and weighted average of 12.6%, a difference of 7.0%.
Disability Age 35 to 64 Correlation Summary
| Measurement | Immigrants from West Indies | White/Caucasian |
| Minimum | 7.1% | 10.1% |
| Maximum | 36.2% | 19.8% |
| Range | 29.1% | 9.7% |
| Mean | 14.9% | 13.4% |
| Median | 11.4% | 12.7% |
| Interquartile 25% (IQ1) | 8.5% | 12.2% |
| Interquartile 75% (IQ3) | 17.2% | 14.0% |
| Interquartile Range (IQR) | 8.7% | 1.8% |
| Standard Deviation (Sample) | 8.8% | 1.8% |
| Standard Deviation (Population) | 8.5% | 1.8% |
Similar Demographics by Disability Age 35 to 64
Demographics Similar to Immigrants from West Indies by Disability Age 35 to 64
In terms of disability age 35 to 64, the demographic groups most similar to Immigrants from West Indies are Czechoslovakian (11.8%, a difference of 0.050%), Immigrants from Bahamas (11.8%, a difference of 0.090%), Alsatian (11.8%, a difference of 0.090%), Honduran (11.8%, a difference of 0.10%), and Immigrants from Honduras (11.8%, a difference of 0.11%).
| Demographics | Rating | Rank | Disability Age 35 to 64 |
| Yugoslavians | 11.6 /100 | #213 | Poor 11.7% |
| Immigrants | Sudan | 11.4 /100 | #214 | Poor 11.7% |
| Spanish American Indians | 11.1 /100 | #215 | Poor 11.7% |
| Bahamians | 10.7 /100 | #216 | Poor 11.8% |
| Barbadians | 9.5 /100 | #217 | Tragic 11.8% |
| Immigrants | Bahamas | 9.2 /100 | #218 | Tragic 11.8% |
| Czechoslovakians | 9.0 /100 | #219 | Tragic 11.8% |
| Immigrants | West Indies | 8.9 /100 | #220 | Tragic 11.8% |
| Alsatians | 8.5 /100 | #221 | Tragic 11.8% |
| Hondurans | 8.4 /100 | #222 | Tragic 11.8% |
| Immigrants | Honduras | 8.4 /100 | #223 | Tragic 11.8% |
| Immigrants | Ghana | 7.8 /100 | #224 | Tragic 11.8% |
| Immigrants | Belize | 6.6 /100 | #225 | Tragic 11.9% |
| Scandinavians | 6.4 /100 | #226 | Tragic 11.9% |
| Immigrants | Central America | 6.3 /100 | #227 | Tragic 11.9% |
Demographics Similar to Whites/Caucasians by Disability Age 35 to 64
In terms of disability age 35 to 64, the demographic groups most similar to Whites/Caucasians are Subsaharan African (12.6%, a difference of 0.16%), Immigrants from Dominica (12.7%, a difference of 0.34%), Spanish (12.7%, a difference of 0.44%), French (12.7%, a difference of 0.48%), and Marshallese (12.5%, a difference of 0.71%).
| Demographics | Rating | Rank | Disability Age 35 to 64 |
| English | 0.6 /100 | #259 | Tragic 12.4% |
| German Russians | 0.5 /100 | #260 | Tragic 12.5% |
| Malaysians | 0.5 /100 | #261 | Tragic 12.5% |
| Senegalese | 0.5 /100 | #262 | Tragic 12.5% |
| Immigrants | Zaire | 0.4 /100 | #263 | Tragic 12.5% |
| Immigrants | Portugal | 0.4 /100 | #264 | Tragic 12.5% |
| Marshallese | 0.4 /100 | #265 | Tragic 12.5% |
| Whites/Caucasians | 0.3 /100 | #266 | Tragic 12.6% |
| Sub-Saharan Africans | 0.2 /100 | #267 | Tragic 12.6% |
| Immigrants | Dominica | 0.2 /100 | #268 | Tragic 12.7% |
| Spanish | 0.2 /100 | #269 | Tragic 12.7% |
| French | 0.2 /100 | #270 | Tragic 12.7% |
| Nepalese | 0.1 /100 | #271 | Tragic 12.8% |
| U.S. Virgin Islanders | 0.1 /100 | #272 | Tragic 12.8% |
| Pennsylvania Germans | 0.1 /100 | #273 | Tragic 12.8% |