Immigrants from West Indies vs Immigrants from Venezuela 2nd Grade
COMPARE
Immigrants from West Indies
Immigrants from Venezuela
2nd Grade
2nd Grade Comparison
Immigrants from West Indies
Immigrants from Venezuela
97.2%
2ND GRADE
0.0/ 100
METRIC RATING
284th/ 347
METRIC RANK
97.9%
2ND GRADE
46.1/ 100
METRIC RATING
179th/ 347
METRIC RANK
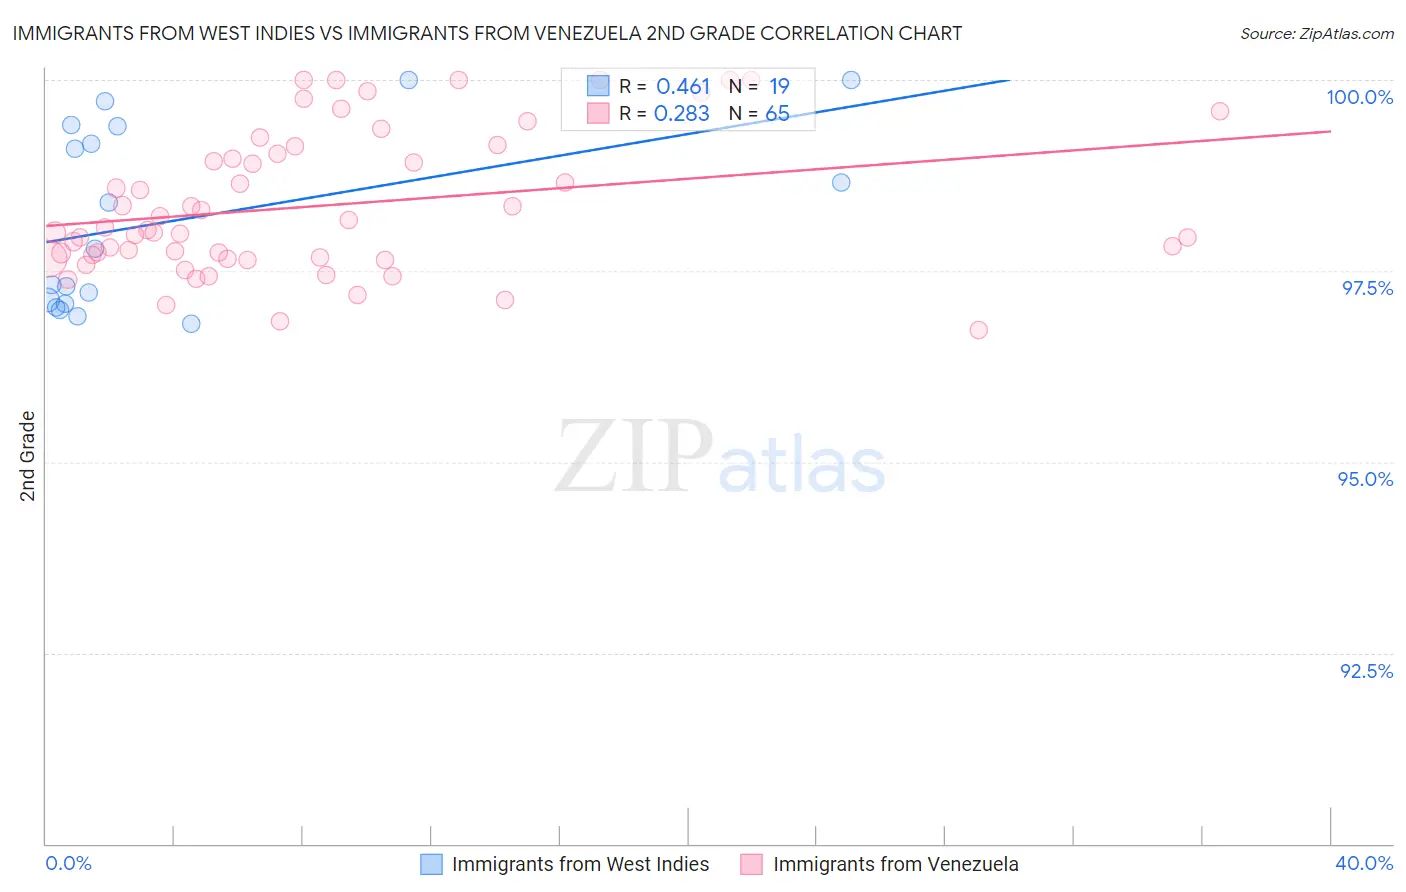
Immigrants from West Indies vs Immigrants from Venezuela 2nd Grade Correlation Chart
The statistical analysis conducted on geographies consisting of 72,457,514 people shows a moderate positive correlation between the proportion of Immigrants from West Indies and percentage of population with at least 2nd grade education in the United States with a correlation coefficient (R) of 0.461 and weighted average of 97.2%. Similarly, the statistical analysis conducted on geographies consisting of 287,866,009 people shows a weak positive correlation between the proportion of Immigrants from Venezuela and percentage of population with at least 2nd grade education in the United States with a correlation coefficient (R) of 0.283 and weighted average of 97.9%, a difference of 0.64%.
2nd Grade Correlation Summary
| Measurement | Immigrants from West Indies | Immigrants from Venezuela |
| Minimum | 96.8% | 96.7% |
| Maximum | 100.0% | 100.0% |
| Range | 3.2% | 3.3% |
| Mean | 98.2% | 98.4% |
| Median | 97.8% | 98.0% |
| Interquartile 25% (IQ1) | 97.1% | 97.7% |
| Interquartile 75% (IQ3) | 99.4% | 99.1% |
| Interquartile Range (IQR) | 2.3% | 1.4% |
| Standard Deviation (Sample) | 1.2% | 0.92% |
| Standard Deviation (Population) | 1.2% | 0.91% |
Similar Demographics by 2nd Grade
Demographics Similar to Immigrants from West Indies by 2nd Grade
In terms of 2nd grade, the demographic groups most similar to Immigrants from West Indies are Immigrants from Trinidad and Tobago (97.2%, a difference of 0.010%), Immigrants from Hong Kong (97.2%, a difference of 0.010%), Immigrants from Barbados (97.2%, a difference of 0.020%), Immigrants from Portugal (97.2%, a difference of 0.020%), and Immigrants from Thailand (97.2%, a difference of 0.020%).
| Demographics | Rating | Rank | 2nd Grade |
| Immigrants | Western Africa | 0.1 /100 | #277 | Tragic 97.3% |
| Immigrants | Uzbekistan | 0.1 /100 | #278 | Tragic 97.3% |
| Immigrants | Ghana | 0.1 /100 | #279 | Tragic 97.3% |
| Afghans | 0.1 /100 | #280 | Tragic 97.3% |
| Trinidadians and Tobagonians | 0.1 /100 | #281 | Tragic 97.3% |
| Barbadians | 0.1 /100 | #282 | Tragic 97.3% |
| Immigrants | Trinidad and Tobago | 0.0 /100 | #283 | Tragic 97.2% |
| Immigrants | West Indies | 0.0 /100 | #284 | Tragic 97.2% |
| Immigrants | Hong Kong | 0.0 /100 | #285 | Tragic 97.2% |
| Immigrants | Barbados | 0.0 /100 | #286 | Tragic 97.2% |
| Immigrants | Portugal | 0.0 /100 | #287 | Tragic 97.2% |
| Immigrants | Thailand | 0.0 /100 | #288 | Tragic 97.2% |
| Houma | 0.0 /100 | #289 | Tragic 97.2% |
| Immigrants | St. Vincent and the Grenadines | 0.0 /100 | #290 | Tragic 97.2% |
| Immigrants | Afghanistan | 0.0 /100 | #291 | Tragic 97.2% |
Demographics Similar to Immigrants from Venezuela by 2nd Grade
In terms of 2nd grade, the demographic groups most similar to Immigrants from Venezuela are Immigrants from Brazil (97.9%, a difference of 0.0%), Argentinean (97.9%, a difference of 0.0%), Immigrants from Micronesia (97.9%, a difference of 0.010%), Immigrants from Bosnia and Herzegovina (97.9%, a difference of 0.010%), and Immigrants from Sri Lanka (97.9%, a difference of 0.010%).
| Demographics | Rating | Rank | 2nd Grade |
| Immigrants | Korea | 52.7 /100 | #172 | Average 97.9% |
| Kenyans | 52.7 /100 | #173 | Average 97.9% |
| Immigrants | Micronesia | 50.0 /100 | #174 | Average 97.9% |
| Immigrants | Bosnia and Herzegovina | 49.8 /100 | #175 | Average 97.9% |
| Immigrants | Sri Lanka | 48.7 /100 | #176 | Average 97.9% |
| Immigrants | Brazil | 46.6 /100 | #177 | Average 97.9% |
| Argentineans | 46.3 /100 | #178 | Average 97.9% |
| Immigrants | Venezuela | 46.1 /100 | #179 | Average 97.9% |
| Natives/Alaskans | 44.3 /100 | #180 | Average 97.9% |
| Egyptians | 44.3 /100 | #181 | Average 97.9% |
| Portuguese | 42.4 /100 | #182 | Average 97.8% |
| Immigrants | Poland | 42.2 /100 | #183 | Average 97.8% |
| Immigrants | Belarus | 41.5 /100 | #184 | Average 97.8% |
| Immigrants | Argentina | 40.6 /100 | #185 | Average 97.8% |
| Arabs | 36.9 /100 | #186 | Fair 97.8% |