Immigrants from China vs Lumbee Family Households with Children
COMPARE
Immigrants from China
Lumbee
Family Households with Children
Family Households with Children Comparison
Immigrants from China
Lumbee
27.4%
FAMILY HOUSEHOLDS WITH CHILDREN
49.6/ 100
METRIC RATING
176th/ 347
METRIC RANK
26.3%
FAMILY HOUSEHOLDS WITH CHILDREN
0.0/ 100
METRIC RATING
308th/ 347
METRIC RANK
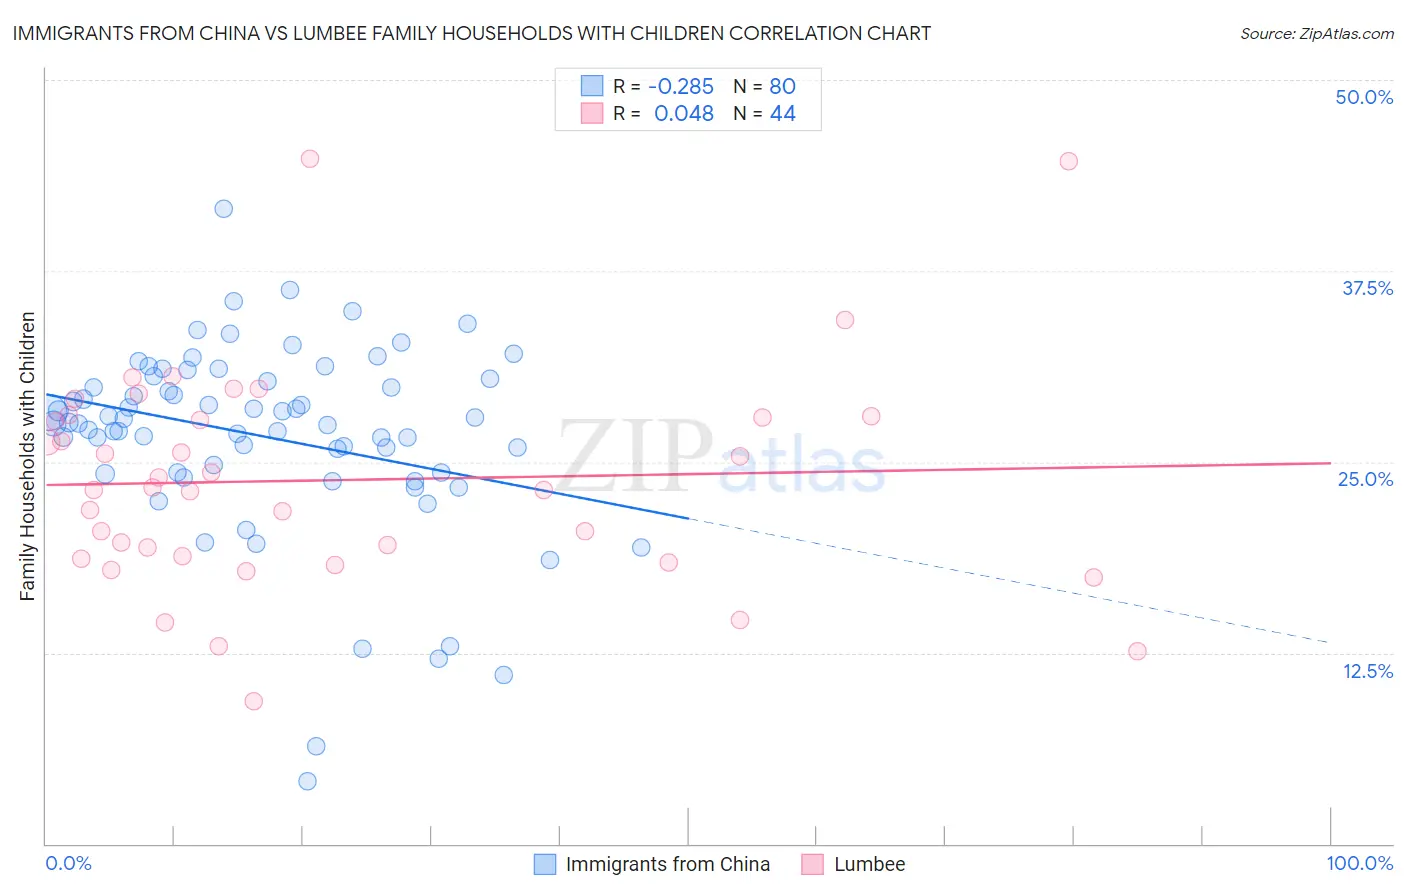
Immigrants from China vs Lumbee Family Households with Children Correlation Chart
The statistical analysis conducted on geographies consisting of 456,380,554 people shows a weak negative correlation between the proportion of Immigrants from China and percentage of family households with children in the United States with a correlation coefficient (R) of -0.285 and weighted average of 27.4%. Similarly, the statistical analysis conducted on geographies consisting of 92,262,389 people shows no correlation between the proportion of Lumbee and percentage of family households with children in the United States with a correlation coefficient (R) of 0.048 and weighted average of 26.3%, a difference of 4.4%.
Family Households with Children Correlation Summary
| Measurement | Immigrants from China | Lumbee |
| Minimum | 4.1% | 9.3% |
| Maximum | 41.6% | 44.9% |
| Range | 37.5% | 35.5% |
| Mean | 26.7% | 23.8% |
| Median | 27.6% | 23.2% |
| Interquartile 25% (IQ1) | 24.3% | 18.7% |
| Interquartile 75% (IQ3) | 30.4% | 27.9% |
| Interquartile Range (IQR) | 6.1% | 9.2% |
| Standard Deviation (Sample) | 6.3% | 7.2% |
| Standard Deviation (Population) | 6.3% | 7.1% |
Similar Demographics by Family Households with Children
Demographics Similar to Immigrants from China by Family Households with Children
In terms of family households with children, the demographic groups most similar to Immigrants from China are White/Caucasian (27.4%, a difference of 0.010%), British (27.4%, a difference of 0.010%), Ugandan (27.4%, a difference of 0.010%), Spanish American (27.4%, a difference of 0.020%), and Immigrants from Argentina (27.5%, a difference of 0.060%).
| Demographics | Rating | Rank | Family Households with Children |
| Seminole | 56.9 /100 | #169 | Average 27.5% |
| Cherokee | 56.7 /100 | #170 | Average 27.5% |
| Blackfeet | 54.3 /100 | #171 | Average 27.5% |
| Israelis | 53.9 /100 | #172 | Average 27.5% |
| Immigrants | Argentina | 52.2 /100 | #173 | Average 27.5% |
| Whites/Caucasians | 50.0 /100 | #174 | Average 27.4% |
| British | 49.9 /100 | #175 | Average 27.4% |
| Immigrants | China | 49.6 /100 | #176 | Average 27.4% |
| Ugandans | 49.2 /100 | #177 | Average 27.4% |
| Spanish Americans | 48.9 /100 | #178 | Average 27.4% |
| Turks | 46.9 /100 | #179 | Average 27.4% |
| Immigrants | Turkey | 46.9 /100 | #180 | Average 27.4% |
| Aleuts | 46.7 /100 | #181 | Average 27.4% |
| Puget Sound Salish | 46.2 /100 | #182 | Average 27.4% |
| South Africans | 44.9 /100 | #183 | Average 27.4% |
Demographics Similar to Lumbee by Family Households with Children
In terms of family households with children, the demographic groups most similar to Lumbee are West Indian (26.3%, a difference of 0.020%), Bermudan (26.3%, a difference of 0.10%), Immigrants from Somalia (26.3%, a difference of 0.11%), Guyanese (26.3%, a difference of 0.12%), and Immigrants from Bahamas (26.3%, a difference of 0.14%).
| Demographics | Rating | Rank | Family Households with Children |
| Immigrants | Trinidad and Tobago | 0.1 /100 | #301 | Tragic 26.4% |
| Serbians | 0.1 /100 | #302 | Tragic 26.4% |
| Immigrants | Guyana | 0.1 /100 | #303 | Tragic 26.3% |
| Immigrants | Bahamas | 0.1 /100 | #304 | Tragic 26.3% |
| Guyanese | 0.1 /100 | #305 | Tragic 26.3% |
| Bermudans | 0.1 /100 | #306 | Tragic 26.3% |
| West Indians | 0.0 /100 | #307 | Tragic 26.3% |
| Lumbee | 0.0 /100 | #308 | Tragic 26.3% |
| Immigrants | Somalia | 0.0 /100 | #309 | Tragic 26.3% |
| Marshallese | 0.0 /100 | #310 | Tragic 26.2% |
| Colville | 0.0 /100 | #311 | Tragic 26.2% |
| Immigrants | Czechoslovakia | 0.0 /100 | #312 | Tragic 26.2% |
| Cree | 0.0 /100 | #313 | Tragic 26.2% |
| French Canadians | 0.0 /100 | #314 | Tragic 26.1% |
| Immigrants | Norway | 0.0 /100 | #315 | Tragic 26.1% |