American vs Immigrants from Central America Family Households with Children
COMPARE
American
Immigrants from Central America
Family Households with Children
Family Households with Children Comparison
Americans
Immigrants from Central America
27.3%
FAMILY HOUSEHOLDS WITH CHILDREN
22.8/ 100
METRIC RATING
202nd/ 347
METRIC RANK
31.0%
FAMILY HOUSEHOLDS WITH CHILDREN
100.0/ 100
METRIC RATING
7th/ 347
METRIC RANK
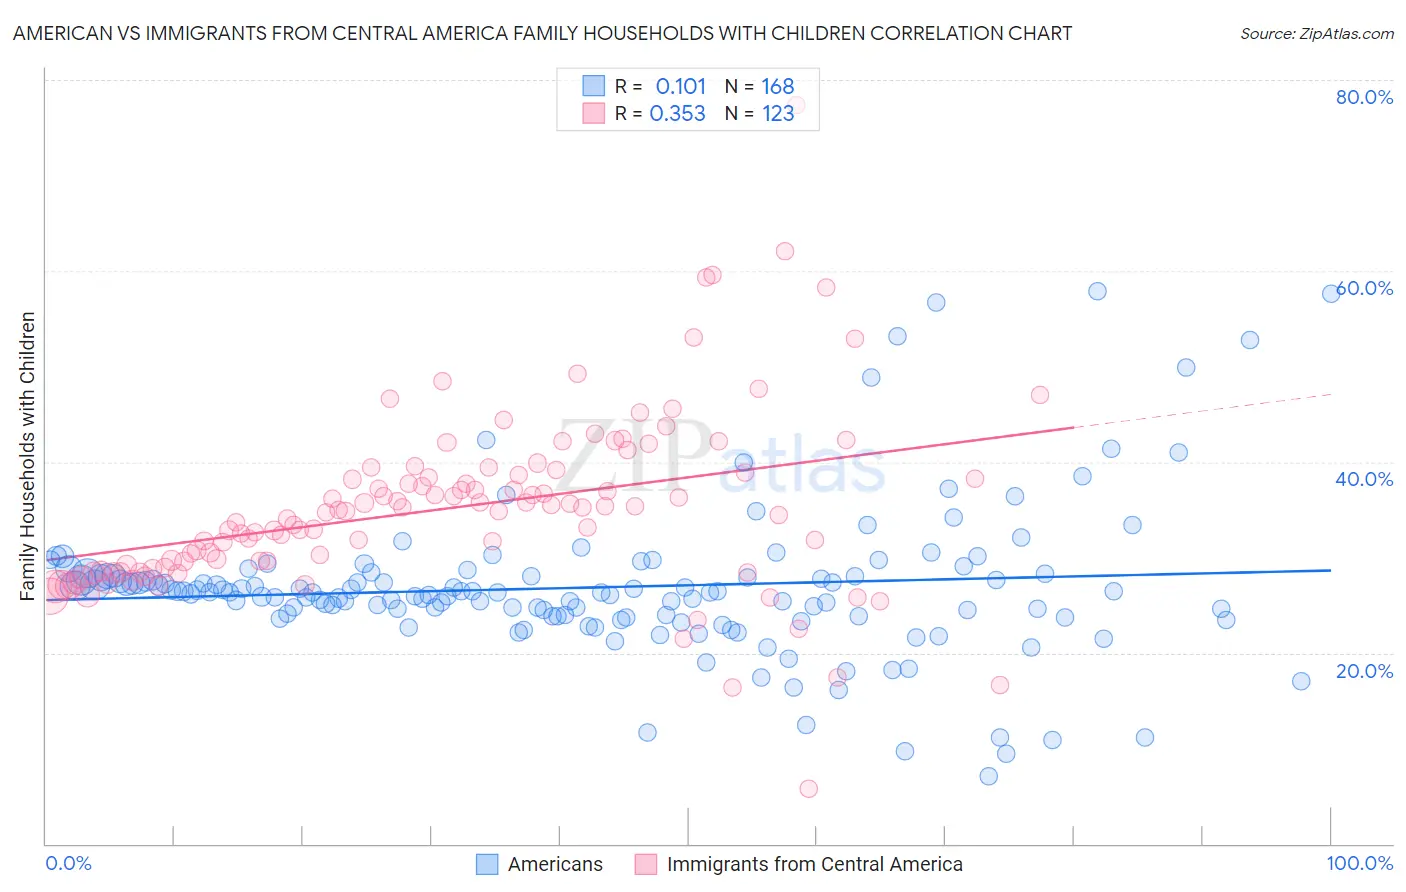
American vs Immigrants from Central America Family Households with Children Correlation Chart
The statistical analysis conducted on geographies consisting of 580,876,887 people shows a poor positive correlation between the proportion of Americans and percentage of family households with children in the United States with a correlation coefficient (R) of 0.101 and weighted average of 27.3%. Similarly, the statistical analysis conducted on geographies consisting of 535,819,231 people shows a mild positive correlation between the proportion of Immigrants from Central America and percentage of family households with children in the United States with a correlation coefficient (R) of 0.353 and weighted average of 31.0%, a difference of 13.5%.
Family Households with Children Correlation Summary
| Measurement | American | Immigrants from Central America |
| Minimum | 7.1% | 5.8% |
| Maximum | 57.9% | 77.4% |
| Range | 50.8% | 71.6% |
| Mean | 26.9% | 35.2% |
| Median | 26.3% | 34.8% |
| Interquartile 25% (IQ1) | 23.8% | 29.0% |
| Interquartile 75% (IQ3) | 28.0% | 38.9% |
| Interquartile Range (IQR) | 4.2% | 9.9% |
| Standard Deviation (Sample) | 7.9% | 9.4% |
| Standard Deviation (Population) | 7.9% | 9.4% |
Similar Demographics by Family Households with Children
Demographics Similar to Americans by Family Households with Children
In terms of family households with children, the demographic groups most similar to Americans are Kiowa (27.3%, a difference of 0.020%), Immigrants from Sudan (27.3%, a difference of 0.040%), Bhutanese (27.3%, a difference of 0.070%), Immigrants from Haiti (27.2%, a difference of 0.080%), and Immigrants from Micronesia (27.2%, a difference of 0.090%).
| Demographics | Rating | Rank | Family Households with Children |
| Crow | 35.7 /100 | #195 | Fair 27.4% |
| Cheyenne | 35.1 /100 | #196 | Fair 27.4% |
| Norwegians | 35.0 /100 | #197 | Fair 27.4% |
| Immigrants | Romania | 34.4 /100 | #198 | Fair 27.4% |
| English | 32.0 /100 | #199 | Fair 27.3% |
| Immigrants | Congo | 28.7 /100 | #200 | Fair 27.3% |
| Bhutanese | 25.1 /100 | #201 | Fair 27.3% |
| Americans | 22.8 /100 | #202 | Fair 27.3% |
| Kiowa | 22.2 /100 | #203 | Fair 27.3% |
| Immigrants | Sudan | 21.6 /100 | #204 | Fair 27.3% |
| Immigrants | Haiti | 20.3 /100 | #205 | Fair 27.2% |
| Immigrants | Micronesia | 20.2 /100 | #206 | Fair 27.2% |
| Haitians | 19.8 /100 | #207 | Poor 27.2% |
| Immigrants | Poland | 16.4 /100 | #208 | Poor 27.2% |
| Dutch West Indians | 15.8 /100 | #209 | Poor 27.2% |
Demographics Similar to Immigrants from Central America by Family Households with Children
In terms of family households with children, the demographic groups most similar to Immigrants from Central America are Immigrants from India (31.0%, a difference of 0.29%), Yakama (30.8%, a difference of 0.57%), Tongan (31.2%, a difference of 0.91%), Thai (30.6%, a difference of 1.1%), and Mexican (31.4%, a difference of 1.3%).
| Demographics | Rating | Rank | Family Households with Children |
| Yup'ik | 100 /100 | #1 | Exceptional 37.0% |
| Inupiat | 100 /100 | #2 | Exceptional 32.8% |
| Immigrants | Mexico | 100.0 /100 | #3 | Exceptional 31.6% |
| Mexicans | 100.0 /100 | #4 | Exceptional 31.4% |
| Tongans | 100.0 /100 | #5 | Exceptional 31.2% |
| Immigrants | India | 100.0 /100 | #6 | Exceptional 31.0% |
| Immigrants | Central America | 100.0 /100 | #7 | Exceptional 31.0% |
| Yakama | 100.0 /100 | #8 | Exceptional 30.8% |
| Thais | 100.0 /100 | #9 | Exceptional 30.6% |
| Immigrants | Fiji | 100.0 /100 | #10 | Exceptional 30.5% |
| Nepalese | 100.0 /100 | #11 | Exceptional 30.5% |
| Immigrants | Pakistan | 100.0 /100 | #12 | Exceptional 30.2% |
| Afghans | 100.0 /100 | #13 | Exceptional 30.2% |
| Bangladeshis | 100.0 /100 | #14 | Exceptional 30.1% |
| Immigrants | South Central Asia | 100.0 /100 | #15 | Exceptional 30.0% |