New Zealander vs English Family Households with Children
COMPARE
New Zealander
English
Family Households with Children
Family Households with Children Comparison
New Zealanders
English
27.1%
FAMILY HOUSEHOLDS WITH CHILDREN
9.6/ 100
METRIC RATING
221st/ 347
METRIC RANK
27.3%
FAMILY HOUSEHOLDS WITH CHILDREN
32.0/ 100
METRIC RATING
199th/ 347
METRIC RANK
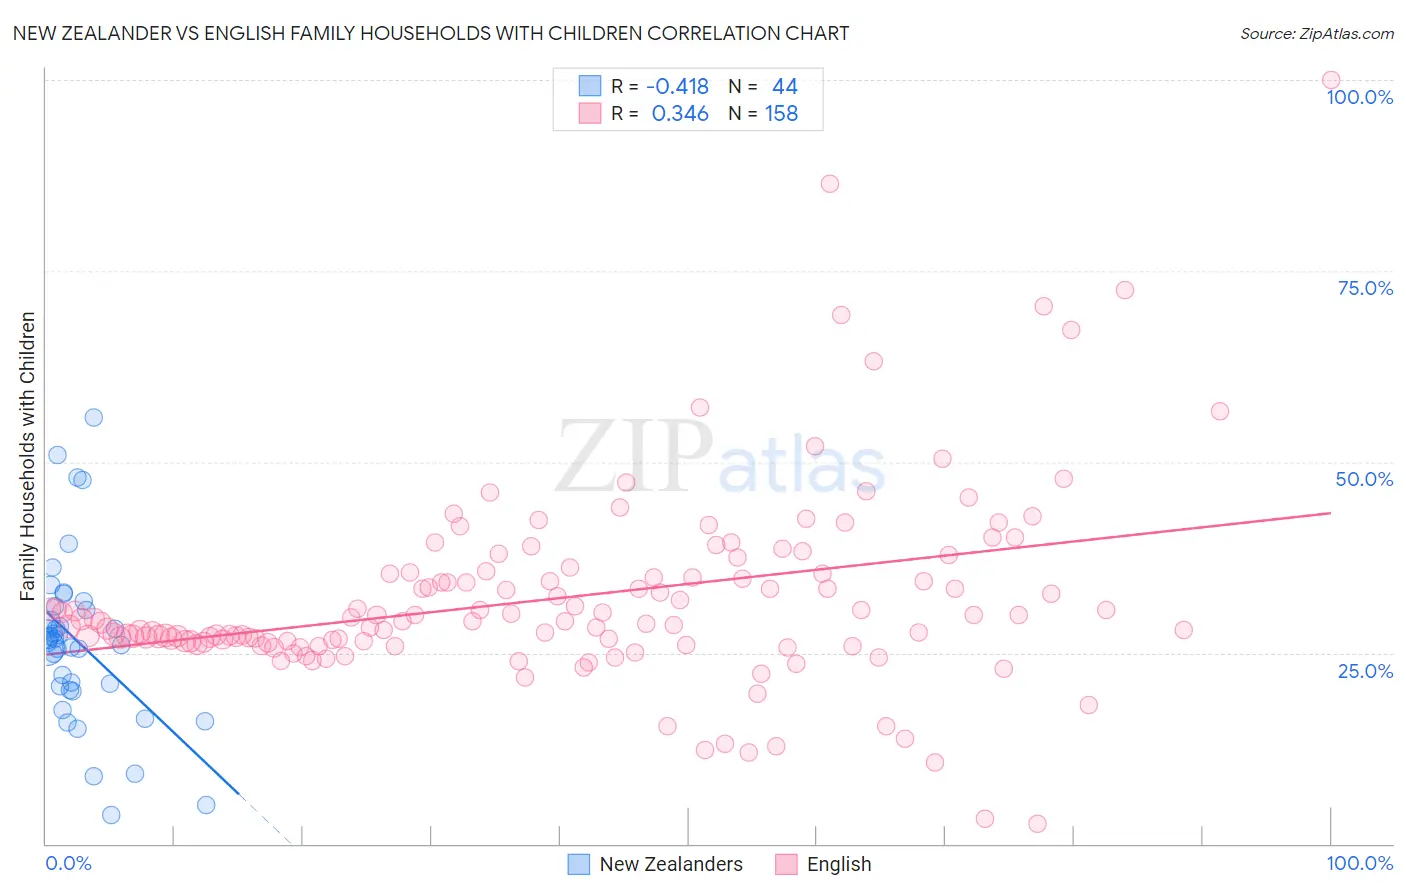
New Zealander vs English Family Households with Children Correlation Chart
The statistical analysis conducted on geographies consisting of 106,880,294 people shows a moderate negative correlation between the proportion of New Zealanders and percentage of family households with children in the United States with a correlation coefficient (R) of -0.418 and weighted average of 27.1%. Similarly, the statistical analysis conducted on geographies consisting of 578,706,985 people shows a mild positive correlation between the proportion of English and percentage of family households with children in the United States with a correlation coefficient (R) of 0.346 and weighted average of 27.3%, a difference of 0.83%.
Family Households with Children Correlation Summary
| Measurement | New Zealander | English |
| Minimum | 3.8% | 2.7% |
| Maximum | 55.8% | 100.0% |
| Range | 52.1% | 97.3% |
| Mean | 26.4% | 32.2% |
| Median | 26.6% | 29.2% |
| Interquartile 25% (IQ1) | 20.4% | 26.5% |
| Interquartile 75% (IQ3) | 30.8% | 35.4% |
| Interquartile Range (IQR) | 10.3% | 8.9% |
| Standard Deviation (Sample) | 11.0% | 12.9% |
| Standard Deviation (Population) | 10.8% | 12.9% |
Similar Demographics by Family Households with Children
Demographics Similar to New Zealanders by Family Households with Children
In terms of family households with children, the demographic groups most similar to New Zealanders are Paraguayan (27.1%, a difference of 0.010%), Austrian (27.1%, a difference of 0.020%), Pima (27.1%, a difference of 0.030%), German (27.1%, a difference of 0.060%), and Immigrants from Japan (27.1%, a difference of 0.070%).
| Demographics | Rating | Rank | Family Households with Children |
| Africans | 13.0 /100 | #214 | Poor 27.2% |
| Northern Europeans | 12.8 /100 | #215 | Poor 27.2% |
| Cubans | 12.2 /100 | #216 | Poor 27.1% |
| U.S. Virgin Islanders | 12.1 /100 | #217 | Poor 27.1% |
| Greeks | 11.4 /100 | #218 | Poor 27.1% |
| Immigrants | Japan | 10.7 /100 | #219 | Poor 27.1% |
| Austrians | 9.9 /100 | #220 | Tragic 27.1% |
| New Zealanders | 9.6 /100 | #221 | Tragic 27.1% |
| Paraguayans | 9.4 /100 | #222 | Tragic 27.1% |
| Pima | 9.2 /100 | #223 | Tragic 27.1% |
| Germans | 8.7 /100 | #224 | Tragic 27.1% |
| Canadians | 7.5 /100 | #225 | Tragic 27.1% |
| Czechoslovakians | 6.6 /100 | #226 | Tragic 27.0% |
| Tsimshian | 6.6 /100 | #227 | Tragic 27.0% |
| Scottish | 6.5 /100 | #228 | Tragic 27.0% |
Demographics Similar to English by Family Households with Children
In terms of family households with children, the demographic groups most similar to English are Immigrants from Romania (27.4%, a difference of 0.060%), Norwegian (27.4%, a difference of 0.070%), Cheyenne (27.4%, a difference of 0.080%), Crow (27.4%, a difference of 0.090%), and Immigrants from Congo (27.3%, a difference of 0.090%).
| Demographics | Rating | Rank | Family Households with Children |
| Pennsylvania Germans | 37.5 /100 | #192 | Fair 27.4% |
| Swedes | 36.9 /100 | #193 | Fair 27.4% |
| Immigrants | Iran | 36.1 /100 | #194 | Fair 27.4% |
| Crow | 35.7 /100 | #195 | Fair 27.4% |
| Cheyenne | 35.1 /100 | #196 | Fair 27.4% |
| Norwegians | 35.0 /100 | #197 | Fair 27.4% |
| Immigrants | Romania | 34.4 /100 | #198 | Fair 27.4% |
| English | 32.0 /100 | #199 | Fair 27.3% |
| Immigrants | Congo | 28.7 /100 | #200 | Fair 27.3% |
| Bhutanese | 25.1 /100 | #201 | Fair 27.3% |
| Americans | 22.8 /100 | #202 | Fair 27.3% |
| Kiowa | 22.2 /100 | #203 | Fair 27.3% |
| Immigrants | Sudan | 21.6 /100 | #204 | Fair 27.3% |
| Immigrants | Haiti | 20.3 /100 | #205 | Fair 27.2% |
| Immigrants | Micronesia | 20.2 /100 | #206 | Fair 27.2% |