Immigrants from Uzbekistan vs Ugandan Family Households with Children
COMPARE
Immigrants from Uzbekistan
Ugandan
Family Households with Children
Family Households with Children Comparison
Immigrants from Uzbekistan
Ugandans
26.7%
FAMILY HOUSEHOLDS WITH CHILDREN
0.9/ 100
METRIC RATING
267th/ 347
METRIC RANK
27.4%
FAMILY HOUSEHOLDS WITH CHILDREN
49.2/ 100
METRIC RATING
177th/ 347
METRIC RANK
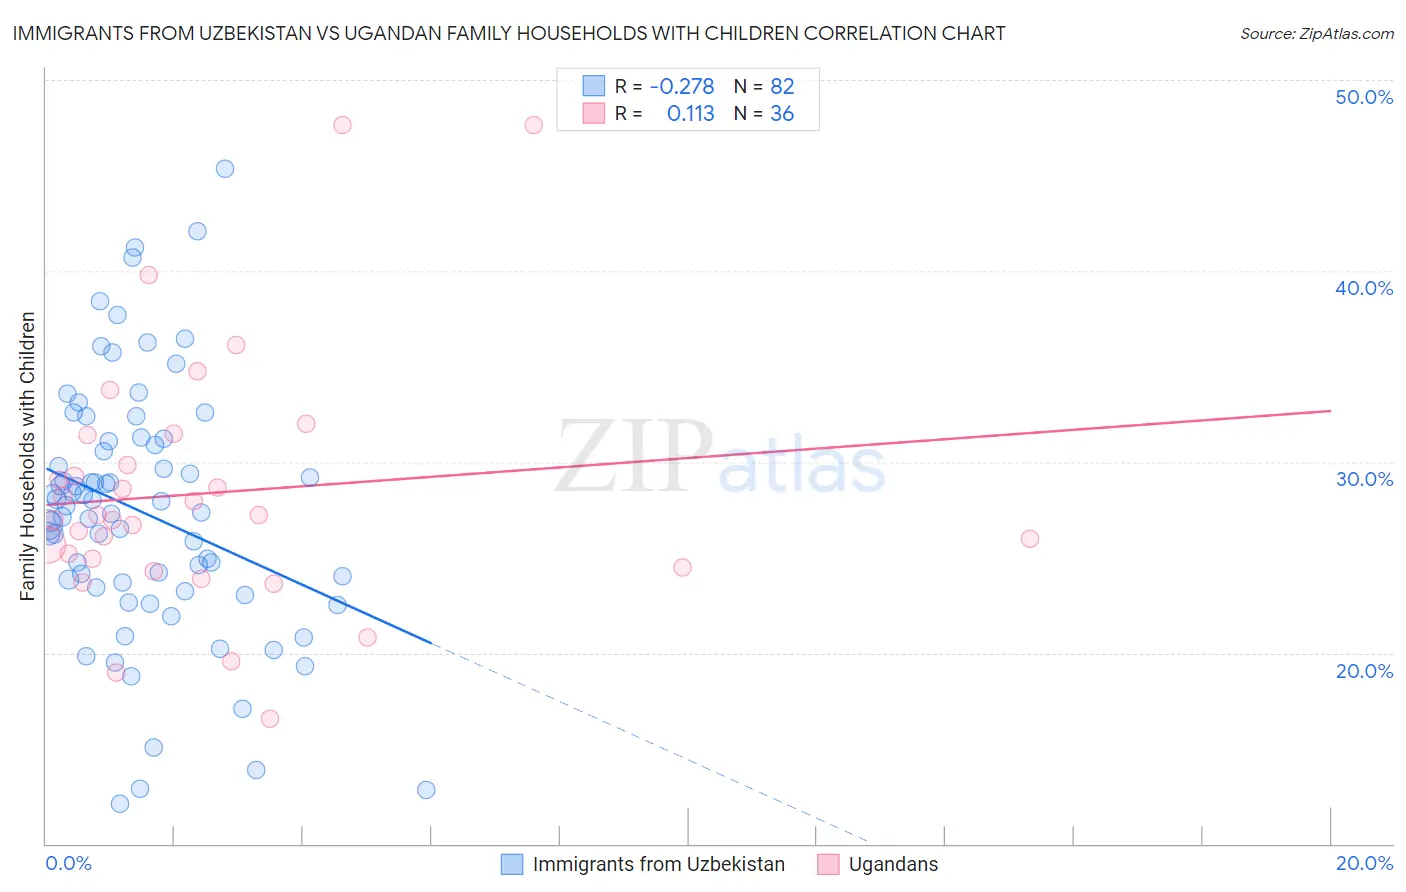
Immigrants from Uzbekistan vs Ugandan Family Households with Children Correlation Chart
The statistical analysis conducted on geographies consisting of 118,662,490 people shows a weak negative correlation between the proportion of Immigrants from Uzbekistan and percentage of family households with children in the United States with a correlation coefficient (R) of -0.278 and weighted average of 26.7%. Similarly, the statistical analysis conducted on geographies consisting of 93,993,745 people shows a poor positive correlation between the proportion of Ugandans and percentage of family households with children in the United States with a correlation coefficient (R) of 0.113 and weighted average of 27.4%, a difference of 2.6%.
Family Households with Children Correlation Summary
| Measurement | Immigrants from Uzbekistan | Ugandan |
| Minimum | 12.1% | 16.6% |
| Maximum | 45.4% | 47.7% |
| Range | 33.3% | 31.1% |
| Mean | 27.3% | 28.4% |
| Median | 27.5% | 27.1% |
| Interquartile 25% (IQ1) | 23.4% | 24.7% |
| Interquartile 75% (IQ3) | 31.1% | 30.6% |
| Interquartile Range (IQR) | 7.7% | 5.9% |
| Standard Deviation (Sample) | 6.7% | 6.7% |
| Standard Deviation (Population) | 6.6% | 6.6% |
Similar Demographics by Family Households with Children
Demographics Similar to Immigrants from Uzbekistan by Family Households with Children
In terms of family households with children, the demographic groups most similar to Immigrants from Uzbekistan are Maltese (26.7%, a difference of 0.0%), Taiwanese (26.7%, a difference of 0.010%), Chippewa (26.7%, a difference of 0.010%), Immigrants from Belgium (26.7%, a difference of 0.010%), and Immigrants from Russia (26.8%, a difference of 0.050%).
| Demographics | Rating | Rank | Family Households with Children |
| Immigrants | Jamaica | 1.2 /100 | #260 | Tragic 26.8% |
| Immigrants | Belarus | 1.1 /100 | #261 | Tragic 26.8% |
| Immigrants | Russia | 1.0 /100 | #262 | Tragic 26.8% |
| Immigrants | North Macedonia | 1.0 /100 | #263 | Tragic 26.7% |
| Taiwanese | 0.9 /100 | #264 | Tragic 26.7% |
| Chippewa | 0.9 /100 | #265 | Tragic 26.7% |
| Maltese | 0.9 /100 | #266 | Tragic 26.7% |
| Immigrants | Uzbekistan | 0.9 /100 | #267 | Tragic 26.7% |
| Immigrants | Belgium | 0.9 /100 | #268 | Tragic 26.7% |
| Immigrants | Denmark | 0.8 /100 | #269 | Tragic 26.7% |
| Immigrants | Zaire | 0.7 /100 | #270 | Tragic 26.7% |
| French | 0.7 /100 | #271 | Tragic 26.7% |
| Somalis | 0.7 /100 | #272 | Tragic 26.7% |
| Immigrants | Hungary | 0.6 /100 | #273 | Tragic 26.7% |
| Eastern Europeans | 0.6 /100 | #274 | Tragic 26.7% |
Demographics Similar to Ugandans by Family Households with Children
In terms of family households with children, the demographic groups most similar to Ugandans are Immigrants from China (27.4%, a difference of 0.010%), Spanish American (27.4%, a difference of 0.010%), White/Caucasian (27.4%, a difference of 0.020%), British (27.4%, a difference of 0.020%), and Turkish (27.4%, a difference of 0.050%).
| Demographics | Rating | Rank | Family Households with Children |
| Cherokee | 56.7 /100 | #170 | Average 27.5% |
| Blackfeet | 54.3 /100 | #171 | Average 27.5% |
| Israelis | 53.9 /100 | #172 | Average 27.5% |
| Immigrants | Argentina | 52.2 /100 | #173 | Average 27.5% |
| Whites/Caucasians | 50.0 /100 | #174 | Average 27.4% |
| British | 49.9 /100 | #175 | Average 27.4% |
| Immigrants | China | 49.6 /100 | #176 | Average 27.4% |
| Ugandans | 49.2 /100 | #177 | Average 27.4% |
| Spanish Americans | 48.9 /100 | #178 | Average 27.4% |
| Turks | 46.9 /100 | #179 | Average 27.4% |
| Immigrants | Turkey | 46.9 /100 | #180 | Average 27.4% |
| Aleuts | 46.7 /100 | #181 | Average 27.4% |
| Puget Sound Salish | 46.2 /100 | #182 | Average 27.4% |
| South Africans | 44.9 /100 | #183 | Average 27.4% |
| Native Hawaiians | 44.6 /100 | #184 | Average 27.4% |