Immigrants from Uzbekistan vs Taiwanese Householder Income Under 25 years
COMPARE
Immigrants from Uzbekistan
Taiwanese
Householder Income Under 25 years
Householder Income Under 25 years Comparison
Immigrants from Uzbekistan
Taiwanese
$54,846
HOUSEHOLDER INCOME UNDER 25 YEARS
99.8/ 100
METRIC RATING
62nd/ 347
METRIC RANK
$49,804
HOUSEHOLDER INCOME UNDER 25 YEARS
0.3/ 100
METRIC RATING
271st/ 347
METRIC RANK
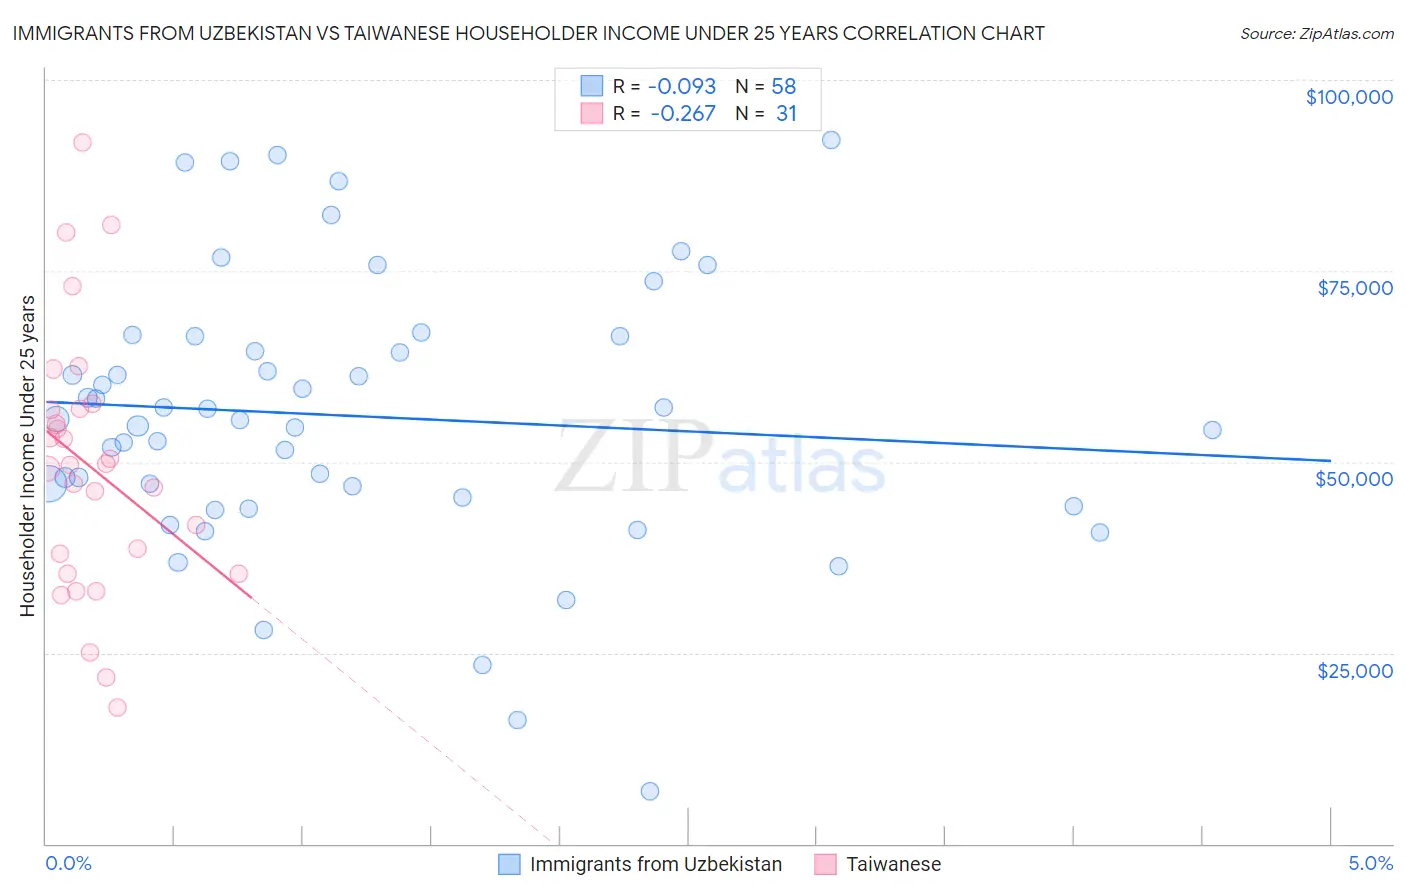
Immigrants from Uzbekistan vs Taiwanese Householder Income Under 25 years Correlation Chart
The statistical analysis conducted on geographies consisting of 107,079,735 people shows a slight negative correlation between the proportion of Immigrants from Uzbekistan and household income with householder under the age of 25 in the United States with a correlation coefficient (R) of -0.093 and weighted average of $54,846. Similarly, the statistical analysis conducted on geographies consisting of 31,064,983 people shows a weak negative correlation between the proportion of Taiwanese and household income with householder under the age of 25 in the United States with a correlation coefficient (R) of -0.267 and weighted average of $49,804, a difference of 10.1%.
Householder Income Under 25 years Correlation Summary
| Measurement | Immigrants from Uzbekistan | Taiwanese |
| Minimum | $6,940 | $17,865 |
| Maximum | $92,155 | $91,771 |
| Range | $85,215 | $73,906 |
| Mean | $56,006 | $49,314 |
| Median | $55,551 | $49,614 |
| Interquartile 25% (IQ1) | $45,302 | $35,417 |
| Interquartile 75% (IQ3) | $66,438 | $56,998 |
| Interquartile Range (IQR) | $21,136 | $21,581 |
| Standard Deviation (Sample) | $17,863 | $17,111 |
| Standard Deviation (Population) | $17,708 | $16,833 |
Similar Demographics by Householder Income Under 25 years
Demographics Similar to Immigrants from Uzbekistan by Householder Income Under 25 years
In terms of householder income under 25 years, the demographic groups most similar to Immigrants from Uzbekistan are Immigrants from Belgium ($54,830, a difference of 0.030%), Burmese ($54,800, a difference of 0.080%), Yup'ik ($54,732, a difference of 0.21%), Immigrants from Bangladesh ($54,714, a difference of 0.24%), and Okinawan ($54,701, a difference of 0.26%).
| Demographics | Rating | Rank | Householder Income Under 25 years |
| Immigrants | Ukraine | 100.0 /100 | #55 | Exceptional $55,447 |
| Salvadorans | 100.0 /100 | #56 | Exceptional $55,412 |
| Soviet Union | 100.0 /100 | #57 | Exceptional $55,340 |
| Guyanese | 99.9 /100 | #58 | Exceptional $55,210 |
| Native Hawaiians | 99.9 /100 | #59 | Exceptional $55,158 |
| Immigrants | Lithuania | 99.9 /100 | #60 | Exceptional $55,028 |
| Immigrants | Europe | 99.9 /100 | #61 | Exceptional $55,022 |
| Immigrants | Uzbekistan | 99.8 /100 | #62 | Exceptional $54,846 |
| Immigrants | Belgium | 99.8 /100 | #63 | Exceptional $54,830 |
| Burmese | 99.8 /100 | #64 | Exceptional $54,800 |
| Yup'ik | 99.8 /100 | #65 | Exceptional $54,732 |
| Immigrants | Bangladesh | 99.8 /100 | #66 | Exceptional $54,714 |
| Okinawans | 99.8 /100 | #67 | Exceptional $54,701 |
| Tsimshian | 99.8 /100 | #68 | Exceptional $54,649 |
| Samoans | 99.7 /100 | #69 | Exceptional $54,610 |
Demographics Similar to Taiwanese by Householder Income Under 25 years
In terms of householder income under 25 years, the demographic groups most similar to Taiwanese are Colville ($49,774, a difference of 0.060%), Slovak ($49,753, a difference of 0.10%), Immigrants from Senegal ($49,742, a difference of 0.12%), Immigrants from Kenya ($49,633, a difference of 0.34%), and Dominican ($49,633, a difference of 0.34%).
| Demographics | Rating | Rank | Householder Income Under 25 years |
| Fijians | 0.6 /100 | #264 | Tragic $50,132 |
| Belgians | 0.6 /100 | #265 | Tragic $50,113 |
| Immigrants | Venezuela | 0.6 /100 | #266 | Tragic $50,109 |
| Immigrants | Laos | 0.5 /100 | #267 | Tragic $50,041 |
| Venezuelans | 0.5 /100 | #268 | Tragic $50,011 |
| Ute | 0.5 /100 | #269 | Tragic $49,997 |
| Mexicans | 0.5 /100 | #270 | Tragic $49,989 |
| Taiwanese | 0.3 /100 | #271 | Tragic $49,804 |
| Colville | 0.3 /100 | #272 | Tragic $49,774 |
| Slovaks | 0.3 /100 | #273 | Tragic $49,753 |
| Immigrants | Senegal | 0.3 /100 | #274 | Tragic $49,742 |
| Immigrants | Kenya | 0.2 /100 | #275 | Tragic $49,633 |
| Dominicans | 0.2 /100 | #276 | Tragic $49,633 |
| Immigrants | Western Africa | 0.2 /100 | #277 | Tragic $49,621 |
| Nigerians | 0.1 /100 | #278 | Tragic $49,416 |