Immigrants from Uzbekistan vs Taiwanese Kindergarten
COMPARE
Immigrants from Uzbekistan
Taiwanese
Kindergarten
Kindergarten Comparison
Immigrants from Uzbekistan
Taiwanese
97.4%
KINDERGARTEN
0.1/ 100
METRIC RATING
278th/ 347
METRIC RANK
97.5%
KINDERGARTEN
0.4/ 100
METRIC RATING
261st/ 347
METRIC RANK
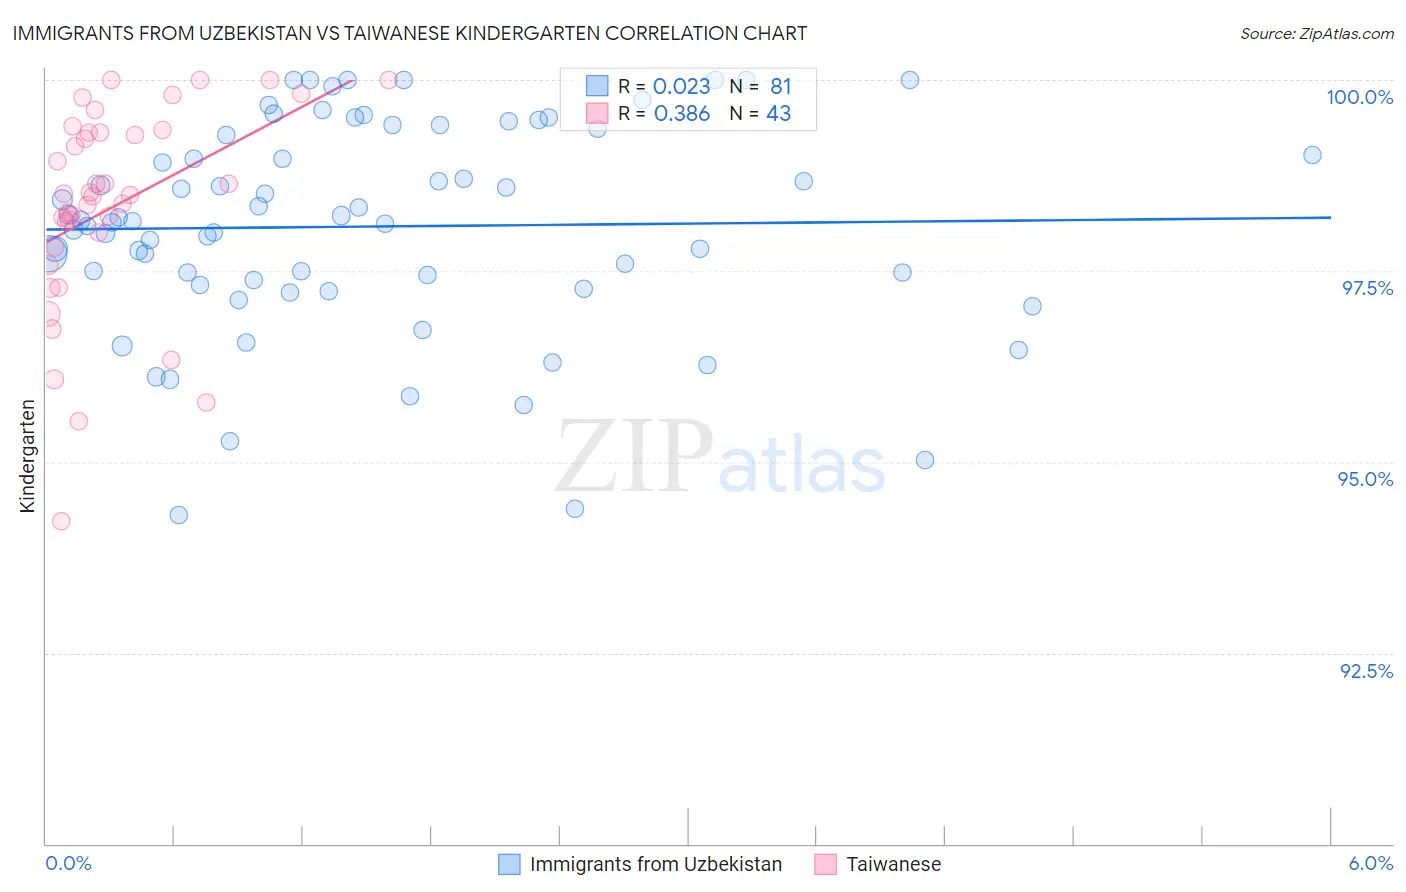
Immigrants from Uzbekistan vs Taiwanese Kindergarten Correlation Chart
The statistical analysis conducted on geographies consisting of 118,593,934 people shows no correlation between the proportion of Immigrants from Uzbekistan and percentage of population with at least kindergarten education in the United States with a correlation coefficient (R) of 0.023 and weighted average of 97.4%. Similarly, the statistical analysis conducted on geographies consisting of 31,677,387 people shows a mild positive correlation between the proportion of Taiwanese and percentage of population with at least kindergarten education in the United States with a correlation coefficient (R) of 0.386 and weighted average of 97.5%, a difference of 0.15%.
Kindergarten Correlation Summary
| Measurement | Immigrants from Uzbekistan | Taiwanese |
| Minimum | 94.3% | 94.2% |
| Maximum | 100.0% | 100.0% |
| Range | 5.7% | 5.8% |
| Mean | 98.1% | 98.3% |
| Median | 98.1% | 98.5% |
| Interquartile 25% (IQ1) | 97.3% | 97.8% |
| Interquartile 75% (IQ3) | 99.3% | 99.3% |
| Interquartile Range (IQR) | 2.0% | 1.5% |
| Standard Deviation (Sample) | 1.4% | 1.3% |
| Standard Deviation (Population) | 1.4% | 1.3% |
Demographics Similar to Immigrants from Uzbekistan and Taiwanese by Kindergarten
In terms of kindergarten, the demographic groups most similar to Immigrants from Uzbekistan are Immigrants from Ghana (97.4%, a difference of 0.010%), Immigrants from Western Africa (97.4%, a difference of 0.020%), Immigrants from Philippines (97.4%, a difference of 0.030%), Immigrants from China (97.4%, a difference of 0.050%), and Immigrants from Cameroon (97.4%, a difference of 0.050%). Similarly, the demographic groups most similar to Taiwanese are Immigrants from Ethiopia (97.5%, a difference of 0.0%), Immigrants from South America (97.5%, a difference of 0.0%), Assyrian/Chaldean/Syriac (97.5%, a difference of 0.0%), Armenian (97.6%, a difference of 0.010%), and Fijian (97.5%, a difference of 0.010%).
| Demographics | Rating | Rank | Kindergarten |
| Armenians | 0.5 /100 | #259 | Tragic 97.6% |
| Fijians | 0.5 /100 | #260 | Tragic 97.5% |
| Taiwanese | 0.4 /100 | #261 | Tragic 97.5% |
| Immigrants | Ethiopia | 0.4 /100 | #262 | Tragic 97.5% |
| Immigrants | South America | 0.4 /100 | #263 | Tragic 97.5% |
| Assyrians/Chaldeans/Syriacs | 0.4 /100 | #264 | Tragic 97.5% |
| Cubans | 0.3 /100 | #265 | Tragic 97.5% |
| Immigrants | Sierra Leone | 0.3 /100 | #266 | Tragic 97.5% |
| Immigrants | Liberia | 0.3 /100 | #267 | Tragic 97.5% |
| Immigrants | Nigeria | 0.3 /100 | #268 | Tragic 97.5% |
| West Indians | 0.3 /100 | #269 | Tragic 97.5% |
| Immigrants | Jamaica | 0.2 /100 | #270 | Tragic 97.5% |
| Immigrants | Peru | 0.2 /100 | #271 | Tragic 97.5% |
| Immigrants | Bolivia | 0.2 /100 | #272 | Tragic 97.5% |
| Immigrants | China | 0.1 /100 | #273 | Tragic 97.4% |
| Immigrants | Cameroon | 0.1 /100 | #274 | Tragic 97.4% |
| Ghanaians | 0.1 /100 | #275 | Tragic 97.4% |
| Immigrants | Philippines | 0.1 /100 | #276 | Tragic 97.4% |
| Immigrants | Western Africa | 0.1 /100 | #277 | Tragic 97.4% |
| Immigrants | Uzbekistan | 0.1 /100 | #278 | Tragic 97.4% |
| Immigrants | Ghana | 0.1 /100 | #279 | Tragic 97.4% |