Dutch West Indian vs Immigrants from Malaysia Single Mother Households
COMPARE
Dutch West Indian
Immigrants from Malaysia
Single Mother Households
Single Mother Households Comparison
Dutch West Indians
Immigrants from Malaysia
7.3%
SINGLE MOTHER HOUSEHOLDS
0.4/ 100
METRIC RATING
247th/ 347
METRIC RANK
5.7%
SINGLE MOTHER HOUSEHOLDS
97.8/ 100
METRIC RATING
82nd/ 347
METRIC RANK
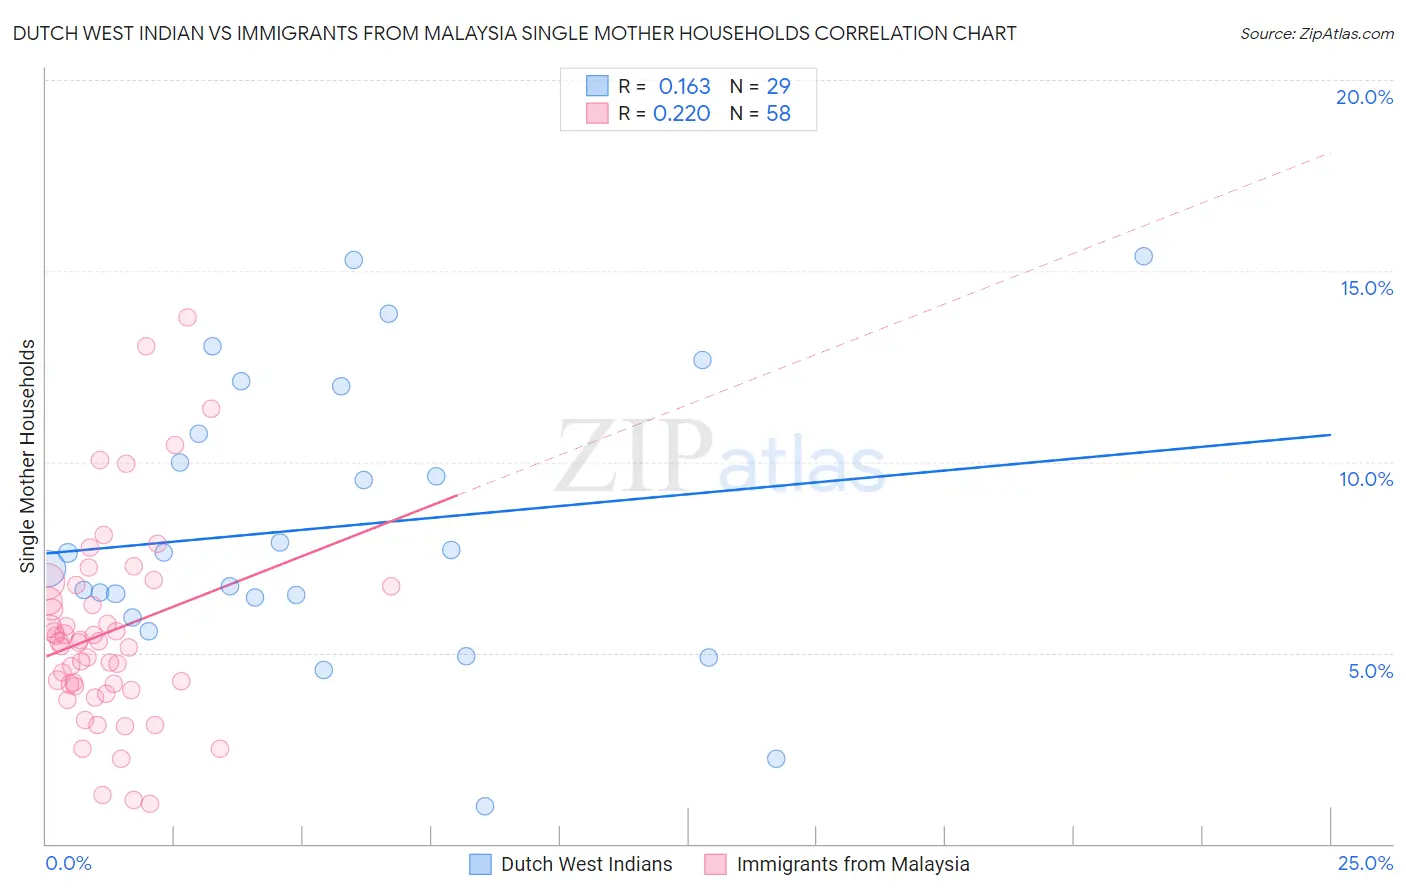
Dutch West Indian vs Immigrants from Malaysia Single Mother Households Correlation Chart
The statistical analysis conducted on geographies consisting of 85,708,147 people shows a poor positive correlation between the proportion of Dutch West Indians and percentage of single mother households in the United States with a correlation coefficient (R) of 0.163 and weighted average of 7.3%. Similarly, the statistical analysis conducted on geographies consisting of 197,805,360 people shows a weak positive correlation between the proportion of Immigrants from Malaysia and percentage of single mother households in the United States with a correlation coefficient (R) of 0.220 and weighted average of 5.7%, a difference of 28.3%.
Single Mother Households Correlation Summary
| Measurement | Dutch West Indian | Immigrants from Malaysia |
| Minimum | 0.97% | 1.0% |
| Maximum | 15.4% | 13.8% |
| Range | 14.4% | 12.7% |
| Mean | 8.3% | 5.5% |
| Median | 7.6% | 5.3% |
| Interquartile 25% (IQ1) | 6.2% | 4.1% |
| Interquartile 75% (IQ3) | 11.3% | 6.8% |
| Interquartile Range (IQR) | 5.2% | 2.6% |
| Standard Deviation (Sample) | 3.6% | 2.6% |
| Standard Deviation (Population) | 3.6% | 2.6% |
Similar Demographics by Single Mother Households
Demographics Similar to Dutch West Indians by Single Mother Households
In terms of single mother households, the demographic groups most similar to Dutch West Indians are Spanish American Indian (7.3%, a difference of 0.030%), Nicaraguan (7.2%, a difference of 0.25%), Bermudan (7.3%, a difference of 0.32%), Immigrants from Africa (7.3%, a difference of 0.33%), and Immigrants from Cambodia (7.2%, a difference of 0.43%).
| Demographics | Rating | Rank | Single Mother Households |
| Immigrants | Panama | 0.7 /100 | #240 | Tragic 7.2% |
| Immigrants | Portugal | 0.6 /100 | #241 | Tragic 7.2% |
| Fijians | 0.6 /100 | #242 | Tragic 7.2% |
| Ecuadorians | 0.6 /100 | #243 | Tragic 7.2% |
| Cubans | 0.6 /100 | #244 | Tragic 7.2% |
| Immigrants | Cambodia | 0.5 /100 | #245 | Tragic 7.2% |
| Nicaraguans | 0.5 /100 | #246 | Tragic 7.2% |
| Dutch West Indians | 0.4 /100 | #247 | Tragic 7.3% |
| Spanish American Indians | 0.4 /100 | #248 | Tragic 7.3% |
| Bermudans | 0.4 /100 | #249 | Tragic 7.3% |
| Immigrants | Africa | 0.4 /100 | #250 | Tragic 7.3% |
| Malaysians | 0.3 /100 | #251 | Tragic 7.3% |
| Alaskan Athabascans | 0.3 /100 | #252 | Tragic 7.3% |
| Cajuns | 0.3 /100 | #253 | Tragic 7.3% |
| Immigrants | Ecuador | 0.3 /100 | #254 | Tragic 7.3% |
Demographics Similar to Immigrants from Malaysia by Single Mother Households
In terms of single mother households, the demographic groups most similar to Immigrants from Malaysia are Immigrants from Hungary (5.7%, a difference of 0.030%), Carpatho Rusyn (5.7%, a difference of 0.10%), Immigrants from Moldova (5.6%, a difference of 0.21%), Czech (5.6%, a difference of 0.22%), and Hungarian (5.7%, a difference of 0.25%).
| Demographics | Rating | Rank | Single Mother Households |
| Slovenes | 98.3 /100 | #75 | Exceptional 5.6% |
| New Zealanders | 98.2 /100 | #76 | Exceptional 5.6% |
| Romanians | 98.1 /100 | #77 | Exceptional 5.6% |
| Swiss | 98.1 /100 | #78 | Exceptional 5.6% |
| Immigrants | Sri Lanka | 98.0 /100 | #79 | Exceptional 5.6% |
| Czechs | 97.9 /100 | #80 | Exceptional 5.6% |
| Immigrants | Moldova | 97.9 /100 | #81 | Exceptional 5.6% |
| Immigrants | Malaysia | 97.8 /100 | #82 | Exceptional 5.7% |
| Immigrants | Hungary | 97.8 /100 | #83 | Exceptional 5.7% |
| Carpatho Rusyns | 97.7 /100 | #84 | Exceptional 5.7% |
| Hungarians | 97.6 /100 | #85 | Exceptional 5.7% |
| Finns | 97.6 /100 | #86 | Exceptional 5.7% |
| Immigrants | Turkey | 97.5 /100 | #87 | Exceptional 5.7% |
| Israelis | 97.4 /100 | #88 | Exceptional 5.7% |
| Ukrainians | 97.2 /100 | #89 | Exceptional 5.7% |