Guatemalan vs Moroccan Single Mother Households
COMPARE
Guatemalan
Moroccan
Single Mother Households
Single Mother Households Comparison
Guatemalans
Moroccans
7.7%
SINGLE MOTHER HOUSEHOLDS
0.0/ 100
METRIC RATING
282nd/ 347
METRIC RANK
6.6%
SINGLE MOTHER HOUSEHOLDS
17.4/ 100
METRIC RATING
197th/ 347
METRIC RANK
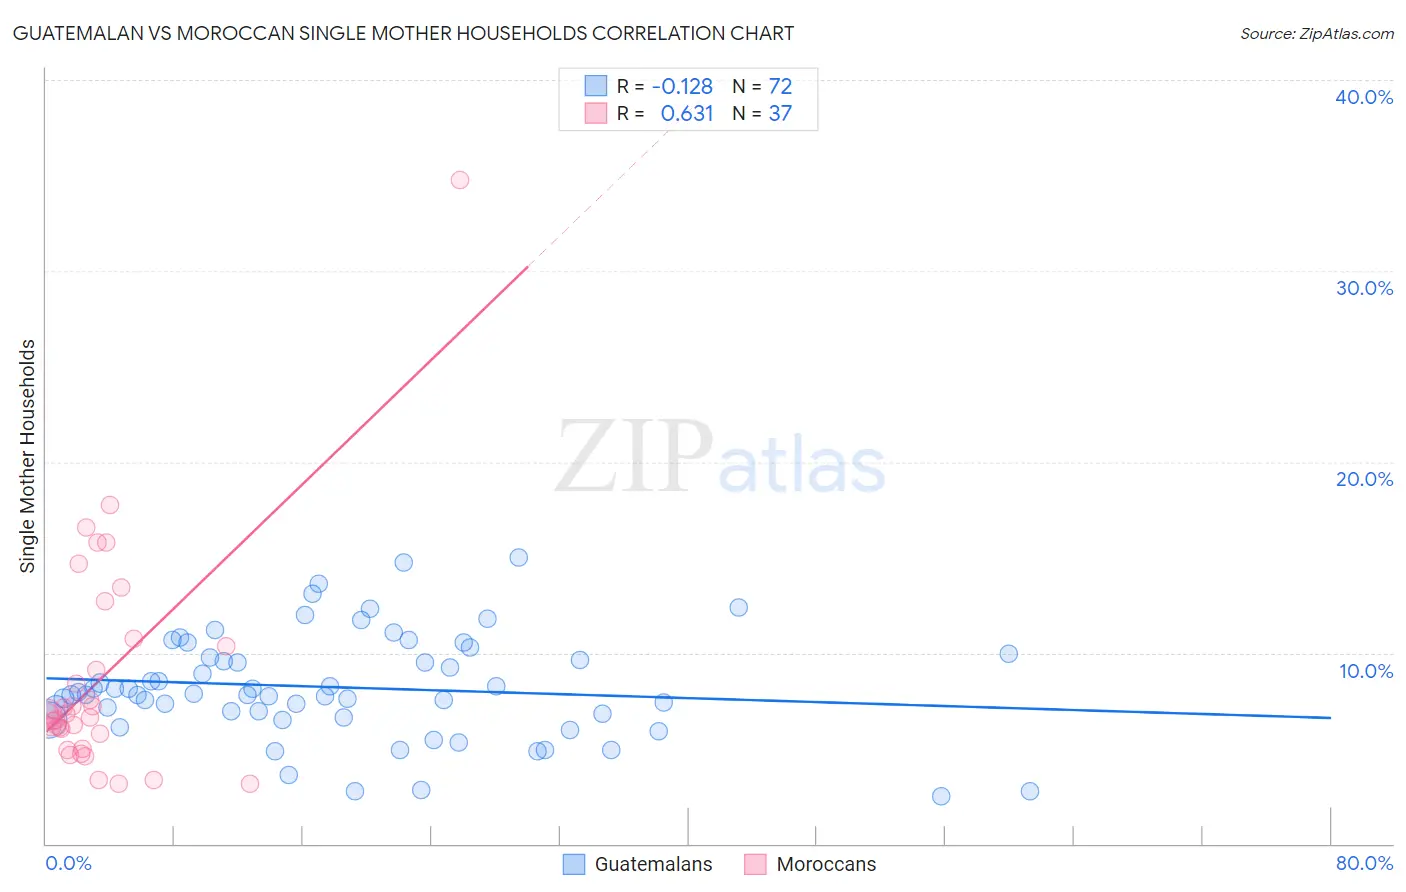
Guatemalan vs Moroccan Single Mother Households Correlation Chart
The statistical analysis conducted on geographies consisting of 408,771,433 people shows a poor negative correlation between the proportion of Guatemalans and percentage of single mother households in the United States with a correlation coefficient (R) of -0.128 and weighted average of 7.7%. Similarly, the statistical analysis conducted on geographies consisting of 201,586,656 people shows a significant positive correlation between the proportion of Moroccans and percentage of single mother households in the United States with a correlation coefficient (R) of 0.631 and weighted average of 6.6%, a difference of 16.5%.
Single Mother Households Correlation Summary
| Measurement | Guatemalan | Moroccan |
| Minimum | 2.5% | 3.1% |
| Maximum | 15.0% | 34.7% |
| Range | 12.5% | 31.6% |
| Mean | 8.2% | 8.7% |
| Median | 7.8% | 6.8% |
| Interquartile 25% (IQ1) | 6.7% | 5.4% |
| Interquartile 75% (IQ3) | 9.9% | 10.6% |
| Interquartile Range (IQR) | 3.1% | 5.2% |
| Standard Deviation (Sample) | 2.7% | 5.9% |
| Standard Deviation (Population) | 2.7% | 5.9% |
Similar Demographics by Single Mother Households
Demographics Similar to Guatemalans by Single Mother Households
In terms of single mother households, the demographic groups most similar to Guatemalans are Immigrants from Sierra Leone (7.7%, a difference of 0.020%), Immigrants from Laos (7.7%, a difference of 0.020%), Nigerian (7.7%, a difference of 0.030%), Immigrants from El Salvador (7.6%, a difference of 0.54%), and Immigrants from Belize (7.7%, a difference of 0.63%).
| Demographics | Rating | Rank | Single Mother Households |
| Central American Indians | 0.1 /100 | #275 | Tragic 7.6% |
| Guyanese | 0.1 /100 | #276 | Tragic 7.6% |
| Immigrants | Trinidad and Tobago | 0.1 /100 | #277 | Tragic 7.6% |
| Central Americans | 0.1 /100 | #278 | Tragic 7.6% |
| Immigrants | El Salvador | 0.0 /100 | #279 | Tragic 7.6% |
| Immigrants | Sierra Leone | 0.0 /100 | #280 | Tragic 7.7% |
| Immigrants | Laos | 0.0 /100 | #281 | Tragic 7.7% |
| Guatemalans | 0.0 /100 | #282 | Tragic 7.7% |
| Nigerians | 0.0 /100 | #283 | Tragic 7.7% |
| Immigrants | Belize | 0.0 /100 | #284 | Tragic 7.7% |
| Trinidadians and Tobagonians | 0.0 /100 | #285 | Tragic 7.7% |
| Immigrants | Middle Africa | 0.0 /100 | #286 | Tragic 7.7% |
| Immigrants | Guatemala | 0.0 /100 | #287 | Tragic 7.7% |
| Sierra Leoneans | 0.0 /100 | #288 | Tragic 7.7% |
| Sub-Saharan Africans | 0.0 /100 | #289 | Tragic 7.8% |
Demographics Similar to Moroccans by Single Mother Households
In terms of single mother households, the demographic groups most similar to Moroccans are South American (6.6%, a difference of 0.11%), Uruguayan (6.6%, a difference of 0.11%), Immigrants from Uganda (6.6%, a difference of 0.15%), Colombian (6.6%, a difference of 0.16%), and Hawaiian (6.6%, a difference of 0.25%).
| Demographics | Rating | Rank | Single Mother Households |
| Peruvians | 21.6 /100 | #190 | Fair 6.5% |
| Samoans | 21.2 /100 | #191 | Fair 6.5% |
| Americans | 19.0 /100 | #192 | Poor 6.6% |
| Colombians | 18.3 /100 | #193 | Poor 6.6% |
| Immigrants | Uganda | 18.3 /100 | #194 | Poor 6.6% |
| South Americans | 18.0 /100 | #195 | Poor 6.6% |
| Uruguayans | 18.0 /100 | #196 | Poor 6.6% |
| Moroccans | 17.4 /100 | #197 | Poor 6.6% |
| Hawaiians | 16.1 /100 | #198 | Poor 6.6% |
| Potawatomi | 15.5 /100 | #199 | Poor 6.6% |
| Immigrants | Ethiopia | 14.7 /100 | #200 | Poor 6.6% |
| Venezuelans | 12.9 /100 | #201 | Poor 6.6% |
| Guamanians/Chamorros | 12.4 /100 | #202 | Poor 6.6% |
| Immigrants | Peru | 12.0 /100 | #203 | Poor 6.7% |
| Immigrants | Fiji | 11.9 /100 | #204 | Poor 6.7% |