Immigrants from Uruguay vs Moroccan 2nd Grade
COMPARE
Immigrants from Uruguay
Moroccan
2nd Grade
2nd Grade Comparison
Immigrants from Uruguay
Moroccans
97.6%
2ND GRADE
2.1/ 100
METRIC RATING
233rd/ 347
METRIC RANK
97.7%
2ND GRADE
8.2/ 100
METRIC RATING
213th/ 347
METRIC RANK
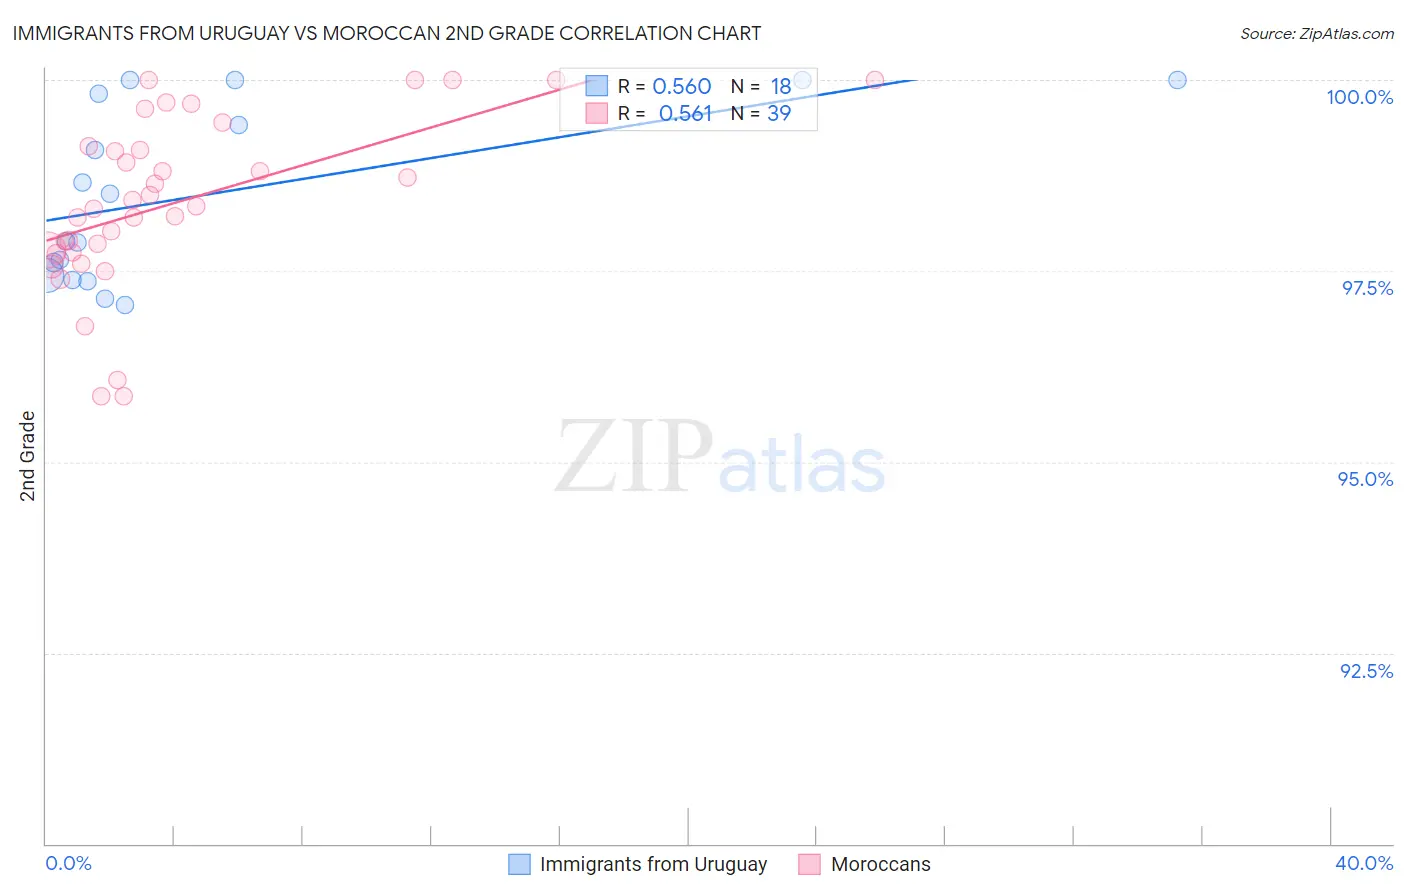
Immigrants from Uruguay vs Moroccan 2nd Grade Correlation Chart
The statistical analysis conducted on geographies consisting of 133,259,667 people shows a substantial positive correlation between the proportion of Immigrants from Uruguay and percentage of population with at least 2nd grade education in the United States with a correlation coefficient (R) of 0.560 and weighted average of 97.6%. Similarly, the statistical analysis conducted on geographies consisting of 201,817,667 people shows a substantial positive correlation between the proportion of Moroccans and percentage of population with at least 2nd grade education in the United States with a correlation coefficient (R) of 0.561 and weighted average of 97.7%, a difference of 0.11%.
2nd Grade Correlation Summary
| Measurement | Immigrants from Uruguay | Moroccan |
| Minimum | 97.1% | 95.9% |
| Maximum | 100.0% | 100.0% |
| Range | 2.9% | 4.1% |
| Mean | 98.5% | 98.4% |
| Median | 98.2% | 98.3% |
| Interquartile 25% (IQ1) | 97.4% | 97.7% |
| Interquartile 75% (IQ3) | 99.8% | 99.1% |
| Interquartile Range (IQR) | 2.4% | 1.4% |
| Standard Deviation (Sample) | 1.1% | 1.1% |
| Standard Deviation (Population) | 1.1% | 1.1% |
Demographics Similar to Immigrants from Uruguay and Moroccans by 2nd Grade
In terms of 2nd grade, the demographic groups most similar to Immigrants from Uruguay are Immigrants from Western Asia (97.6%, a difference of 0.0%), Immigrants from Pakistan (97.6%, a difference of 0.010%), Immigrants from Costa Rica (97.6%, a difference of 0.030%), Senegalese (97.6%, a difference of 0.030%), and Subsaharan African (97.6%, a difference of 0.040%). Similarly, the demographic groups most similar to Moroccans are Samoan (97.7%, a difference of 0.010%), Bahamian (97.7%, a difference of 0.020%), South American Indian (97.7%, a difference of 0.020%), Uruguayan (97.7%, a difference of 0.020%), and Sudanese (97.7%, a difference of 0.030%).
| Demographics | Rating | Rank | 2nd Grade |
| Moroccans | 8.2 /100 | #213 | Tragic 97.7% |
| Samoans | 7.1 /100 | #214 | Tragic 97.7% |
| Bahamians | 6.8 /100 | #215 | Tragic 97.7% |
| South American Indians | 6.7 /100 | #216 | Tragic 97.7% |
| Uruguayans | 6.2 /100 | #217 | Tragic 97.7% |
| Sudanese | 5.7 /100 | #218 | Tragic 97.7% |
| Immigrants | Panama | 5.1 /100 | #219 | Tragic 97.6% |
| Immigrants | Morocco | 5.0 /100 | #220 | Tragic 97.6% |
| Iraqis | 4.6 /100 | #221 | Tragic 97.6% |
| Immigrants | Sudan | 4.5 /100 | #222 | Tragic 97.6% |
| Sierra Leoneans | 4.3 /100 | #223 | Tragic 97.6% |
| Immigrants | Zaire | 4.3 /100 | #224 | Tragic 97.6% |
| Tongans | 4.3 /100 | #225 | Tragic 97.6% |
| Immigrants | Syria | 4.0 /100 | #226 | Tragic 97.6% |
| Immigrants | Nepal | 4.0 /100 | #227 | Tragic 97.6% |
| Sub-Saharan Africans | 3.4 /100 | #228 | Tragic 97.6% |
| Immigrants | Costa Rica | 3.1 /100 | #229 | Tragic 97.6% |
| Senegalese | 3.1 /100 | #230 | Tragic 97.6% |
| Immigrants | Pakistan | 2.3 /100 | #231 | Tragic 97.6% |
| Immigrants | Western Asia | 2.1 /100 | #232 | Tragic 97.6% |
| Immigrants | Uruguay | 2.1 /100 | #233 | Tragic 97.6% |