Immigrants from Uganda vs Nigerian Single Father Households
COMPARE
Immigrants from Uganda
Nigerian
Single Father Households
Single Father Households Comparison
Immigrants from Uganda
Nigerians
2.4%
SINGLE FATHER HOUSEHOLDS
26.0/ 100
METRIC RATING
201st/ 347
METRIC RANK
2.4%
SINGLE FATHER HOUSEHOLDS
41.0/ 100
METRIC RATING
185th/ 347
METRIC RANK
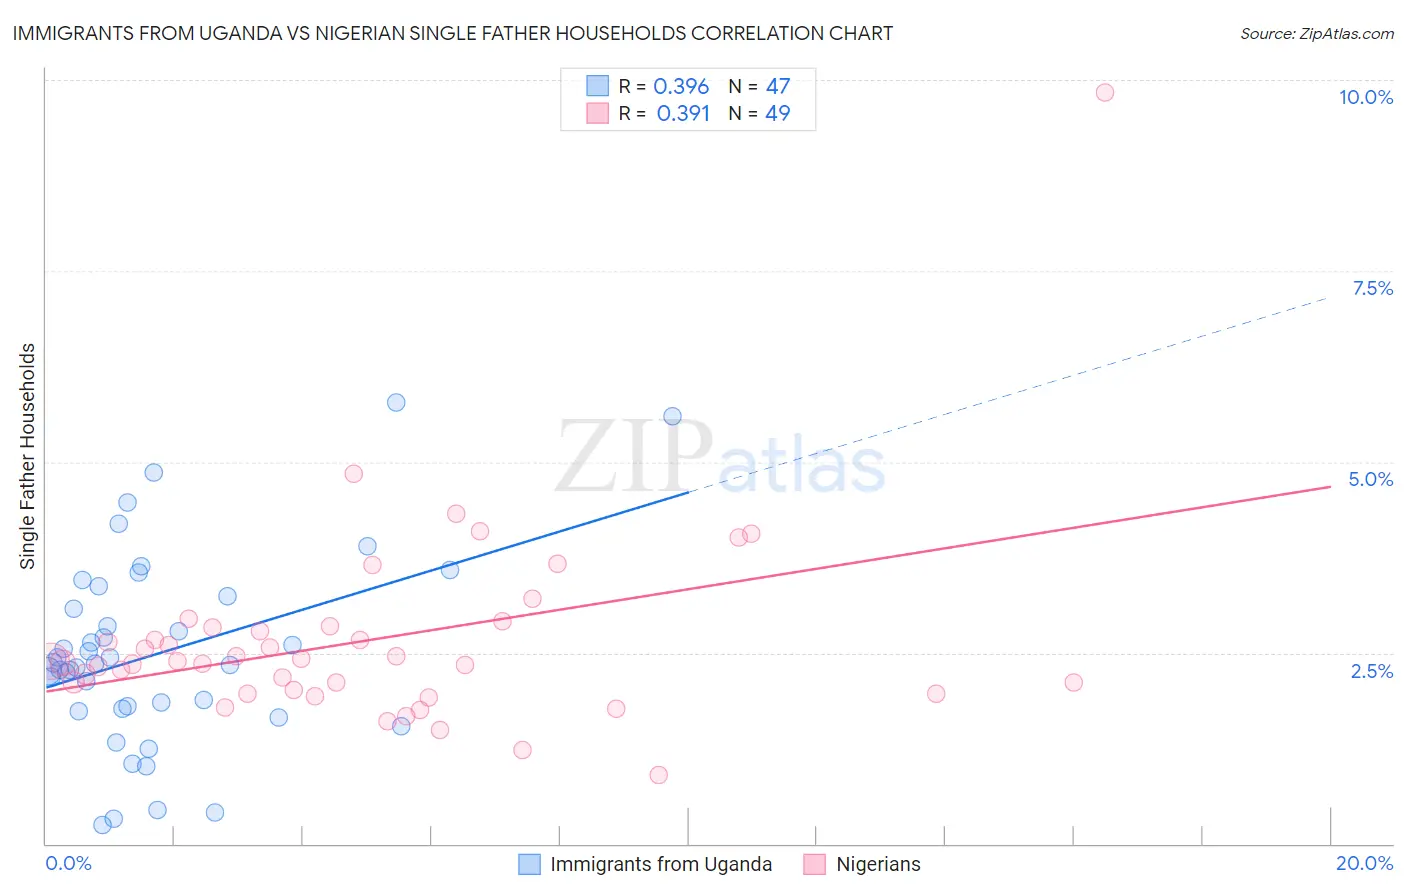
Immigrants from Uganda vs Nigerian Single Father Households Correlation Chart
The statistical analysis conducted on geographies consisting of 125,685,639 people shows a mild positive correlation between the proportion of Immigrants from Uganda and percentage of single father households in the United States with a correlation coefficient (R) of 0.396 and weighted average of 2.4%. Similarly, the statistical analysis conducted on geographies consisting of 330,825,624 people shows a mild positive correlation between the proportion of Nigerians and percentage of single father households in the United States with a correlation coefficient (R) of 0.391 and weighted average of 2.4%, a difference of 1.3%.
Single Father Households Correlation Summary
| Measurement | Immigrants from Uganda | Nigerian |
| Minimum | 0.24% | 0.90% |
| Maximum | 5.8% | 9.8% |
| Range | 5.5% | 8.9% |
| Mean | 2.5% | 2.7% |
| Median | 2.4% | 2.4% |
| Interquartile 25% (IQ1) | 1.8% | 2.0% |
| Interquartile 75% (IQ3) | 3.2% | 2.8% |
| Interquartile Range (IQR) | 1.5% | 0.85% |
| Standard Deviation (Sample) | 1.2% | 1.3% |
| Standard Deviation (Population) | 1.2% | 1.3% |
Demographics Similar to Immigrants from Uganda and Nigerians by Single Father Households
In terms of single father households, the demographic groups most similar to Immigrants from Uganda are German Russian (2.4%, a difference of 0.030%), Immigrants from Vietnam (2.4%, a difference of 0.10%), Peruvian (2.4%, a difference of 0.10%), Scandinavian (2.4%, a difference of 0.13%), and French Canadian (2.4%, a difference of 0.13%). Similarly, the demographic groups most similar to Nigerians are Immigrants from Bosnia and Herzegovina (2.4%, a difference of 0.050%), Immigrants from Panama (2.4%, a difference of 0.060%), Sri Lankan (2.4%, a difference of 0.060%), Immigrants from Colombia (2.4%, a difference of 0.55%), and Hmong (2.4%, a difference of 0.63%).
| Demographics | Rating | Rank | Single Father Households |
| Immigrants | Panama | 41.8 /100 | #183 | Average 2.4% |
| Sri Lankans | 41.8 /100 | #184 | Average 2.4% |
| Nigerians | 41.0 /100 | #185 | Average 2.4% |
| Immigrants | Bosnia and Herzegovina | 40.4 /100 | #186 | Average 2.4% |
| Immigrants | Colombia | 34.0 /100 | #187 | Fair 2.4% |
| Hmong | 33.0 /100 | #188 | Fair 2.4% |
| U.S. Virgin Islanders | 31.8 /100 | #189 | Fair 2.4% |
| French | 31.7 /100 | #190 | Fair 2.4% |
| Immigrants | Africa | 30.0 /100 | #191 | Fair 2.4% |
| Immigrants | Sudan | 29.8 /100 | #192 | Fair 2.4% |
| Uruguayans | 29.7 /100 | #193 | Fair 2.4% |
| Panamanians | 29.6 /100 | #194 | Fair 2.4% |
| Immigrants | Philippines | 28.7 /100 | #195 | Fair 2.4% |
| Kenyans | 28.0 /100 | #196 | Fair 2.4% |
| Germans | 28.0 /100 | #197 | Fair 2.4% |
| Scandinavians | 27.4 /100 | #198 | Fair 2.4% |
| Immigrants | Vietnam | 27.1 /100 | #199 | Fair 2.4% |
| Peruvians | 27.1 /100 | #200 | Fair 2.4% |
| Immigrants | Uganda | 26.0 /100 | #201 | Fair 2.4% |
| German Russians | 25.7 /100 | #202 | Fair 2.4% |
| French Canadians | 24.7 /100 | #203 | Fair 2.4% |