Immigrants from Uganda vs Nigerian Births to Unmarried Women
COMPARE
Immigrants from Uganda
Nigerian
Births to Unmarried Women
Births to Unmarried Women Comparison
Immigrants from Uganda
Nigerians
30.5%
BIRTHS TO UNMARRIED WOMEN
82.6/ 100
METRIC RATING
143rd/ 347
METRIC RANK
35.3%
BIRTHS TO UNMARRIED WOMEN
0.7/ 100
METRIC RATING
246th/ 347
METRIC RANK
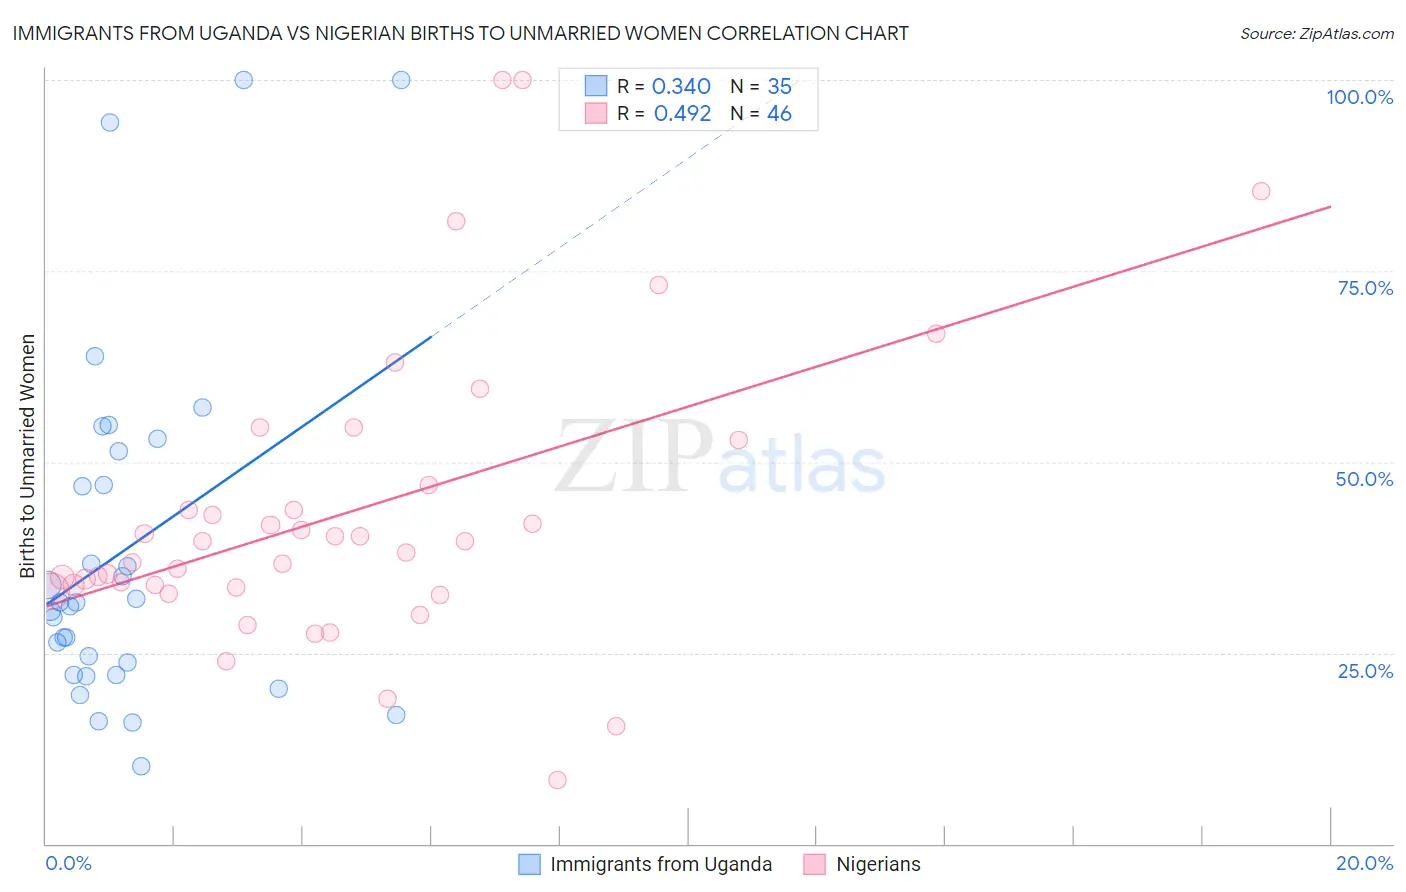
Immigrants from Uganda vs Nigerian Births to Unmarried Women Correlation Chart
The statistical analysis conducted on geographies consisting of 123,239,709 people shows a mild positive correlation between the proportion of Immigrants from Uganda and percentage of births to unmarried women in the United States with a correlation coefficient (R) of 0.340 and weighted average of 30.5%. Similarly, the statistical analysis conducted on geographies consisting of 318,352,588 people shows a moderate positive correlation between the proportion of Nigerians and percentage of births to unmarried women in the United States with a correlation coefficient (R) of 0.492 and weighted average of 35.3%, a difference of 15.8%.
Births to Unmarried Women Correlation Summary
| Measurement | Immigrants from Uganda | Nigerian |
| Minimum | 10.2% | 8.3% |
| Maximum | 100.0% | 100.0% |
| Range | 89.8% | 91.7% |
| Mean | 38.4% | 43.4% |
| Median | 31.6% | 38.8% |
| Interquartile 25% (IQ1) | 22.1% | 33.6% |
| Interquartile 75% (IQ3) | 51.4% | 46.9% |
| Interquartile Range (IQR) | 29.3% | 13.3% |
| Standard Deviation (Sample) | 22.8% | 19.5% |
| Standard Deviation (Population) | 22.5% | 19.3% |
Similar Demographics by Births to Unmarried Women
Demographics Similar to Immigrants from Uganda by Births to Unmarried Women
In terms of births to unmarried women, the demographic groups most similar to Immigrants from Uganda are South African (30.5%, a difference of 0.020%), Czech (30.5%, a difference of 0.070%), Pakistani (30.5%, a difference of 0.080%), Swiss (30.5%, a difference of 0.10%), and Immigrants from North America (30.6%, a difference of 0.17%).
| Demographics | Rating | Rank | Births to Unmarried Women |
| Immigrants | Scotland | 84.6 /100 | #136 | Excellent 30.4% |
| Immigrants | Philippines | 83.9 /100 | #137 | Excellent 30.4% |
| Puget Sound Salish | 83.9 /100 | #138 | Excellent 30.4% |
| Immigrants | Canada | 83.7 /100 | #139 | Excellent 30.4% |
| Swiss | 83.1 /100 | #140 | Excellent 30.5% |
| Pakistanis | 83.0 /100 | #141 | Excellent 30.5% |
| South Africans | 82.7 /100 | #142 | Excellent 30.5% |
| Immigrants | Uganda | 82.6 /100 | #143 | Excellent 30.5% |
| Czechs | 82.1 /100 | #144 | Excellent 30.5% |
| Immigrants | North America | 81.5 /100 | #145 | Excellent 30.6% |
| Northern Europeans | 81.4 /100 | #146 | Excellent 30.6% |
| Immigrants | Oceania | 81.2 /100 | #147 | Excellent 30.6% |
| Chileans | 79.1 /100 | #148 | Good 30.7% |
| Serbians | 78.8 /100 | #149 | Good 30.7% |
| Somalis | 77.8 /100 | #150 | Good 30.7% |
Demographics Similar to Nigerians by Births to Unmarried Women
In terms of births to unmarried women, the demographic groups most similar to Nigerians are Shoshone (35.3%, a difference of 0.11%), Immigrants from Nigeria (35.4%, a difference of 0.21%), Guyanese (35.2%, a difference of 0.45%), Japanese (35.2%, a difference of 0.51%), and Nonimmigrants (35.5%, a difference of 0.54%).
| Demographics | Rating | Rank | Births to Unmarried Women |
| Sierra Leoneans | 1.4 /100 | #239 | Tragic 34.9% |
| Immigrants | Middle Africa | 1.2 /100 | #240 | Tragic 34.9% |
| Immigrants | Guyana | 1.2 /100 | #241 | Tragic 35.0% |
| Indonesians | 1.2 /100 | #242 | Tragic 35.0% |
| Japanese | 0.9 /100 | #243 | Tragic 35.2% |
| Guyanese | 0.9 /100 | #244 | Tragic 35.2% |
| Shoshone | 0.8 /100 | #245 | Tragic 35.3% |
| Nigerians | 0.7 /100 | #246 | Tragic 35.3% |
| Immigrants | Nigeria | 0.7 /100 | #247 | Tragic 35.4% |
| Immigrants | Nonimmigrants | 0.6 /100 | #248 | Tragic 35.5% |
| Bermudans | 0.6 /100 | #249 | Tragic 35.5% |
| Mexican American Indians | 0.4 /100 | #250 | Tragic 35.7% |
| Immigrants | Western Africa | 0.3 /100 | #251 | Tragic 36.0% |
| Salvadorans | 0.3 /100 | #252 | Tragic 36.0% |
| Immigrants | Portugal | 0.2 /100 | #253 | Tragic 36.2% |