Immigrants from Panama vs Nigerian Single Father Households
COMPARE
Immigrants from Panama
Nigerian
Single Father Households
Single Father Households Comparison
Immigrants from Panama
Nigerians
2.4%
SINGLE FATHER HOUSEHOLDS
41.8/ 100
METRIC RATING
183rd/ 347
METRIC RANK
2.4%
SINGLE FATHER HOUSEHOLDS
41.0/ 100
METRIC RATING
185th/ 347
METRIC RANK
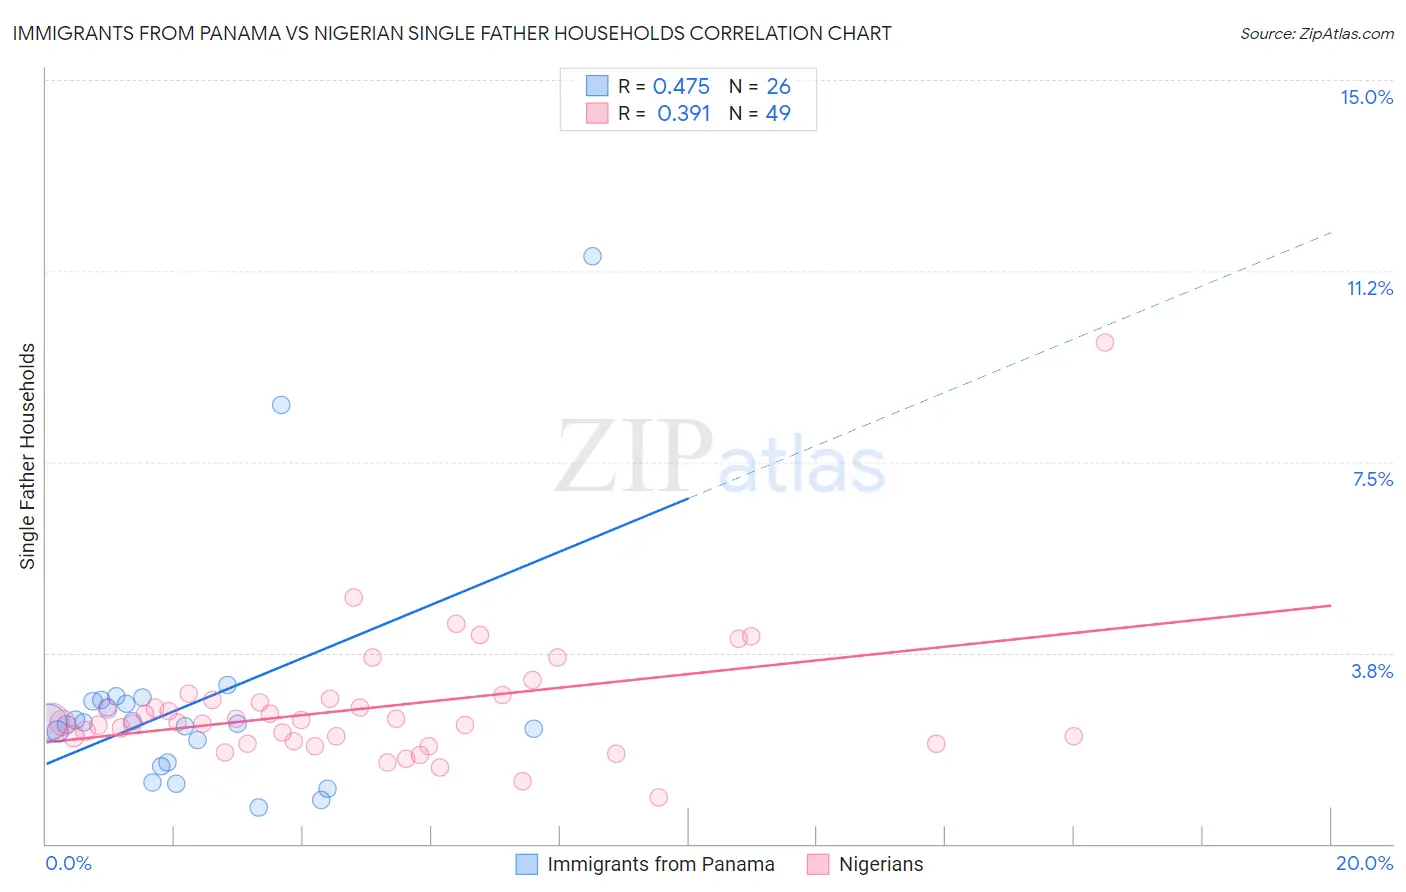
Immigrants from Panama vs Nigerian Single Father Households Correlation Chart
The statistical analysis conducted on geographies consisting of 220,623,122 people shows a moderate positive correlation between the proportion of Immigrants from Panama and percentage of single father households in the United States with a correlation coefficient (R) of 0.475 and weighted average of 2.4%. Similarly, the statistical analysis conducted on geographies consisting of 330,825,624 people shows a mild positive correlation between the proportion of Nigerians and percentage of single father households in the United States with a correlation coefficient (R) of 0.391 and weighted average of 2.4%, a difference of 0.060%.
Single Father Households Correlation Summary
| Measurement | Immigrants from Panama | Nigerian |
| Minimum | 0.72% | 0.90% |
| Maximum | 11.5% | 9.8% |
| Range | 10.8% | 8.9% |
| Mean | 2.7% | 2.7% |
| Median | 2.4% | 2.4% |
| Interquartile 25% (IQ1) | 1.6% | 2.0% |
| Interquartile 75% (IQ3) | 2.8% | 2.8% |
| Interquartile Range (IQR) | 1.2% | 0.85% |
| Standard Deviation (Sample) | 2.3% | 1.3% |
| Standard Deviation (Population) | 2.3% | 1.3% |
Demographics Similar to Immigrants from Panama and Nigerians by Single Father Households
In terms of single father households, the demographic groups most similar to Immigrants from Panama are Sri Lankan (2.4%, a difference of 0.0%), Belgian (2.3%, a difference of 0.11%), Immigrants from Bosnia and Herzegovina (2.4%, a difference of 0.11%), Jamaican (2.3%, a difference of 0.12%), and Yugoslavian (2.3%, a difference of 0.15%). Similarly, the demographic groups most similar to Nigerians are Immigrants from Bosnia and Herzegovina (2.4%, a difference of 0.050%), Sri Lankan (2.4%, a difference of 0.060%), Belgian (2.3%, a difference of 0.17%), Jamaican (2.3%, a difference of 0.18%), and Yugoslavian (2.3%, a difference of 0.21%).
| Demographics | Rating | Rank | Single Father Households |
| Afghans | 50.0 /100 | #174 | Average 2.3% |
| Immigrants | Jamaica | 49.1 /100 | #175 | Average 2.3% |
| Danes | 48.2 /100 | #176 | Average 2.3% |
| Colombians | 48.0 /100 | #177 | Average 2.3% |
| Costa Ricans | 44.1 /100 | #178 | Average 2.3% |
| Welsh | 44.0 /100 | #179 | Average 2.3% |
| Yugoslavians | 43.9 /100 | #180 | Average 2.3% |
| Jamaicans | 43.5 /100 | #181 | Average 2.3% |
| Belgians | 43.3 /100 | #182 | Average 2.3% |
| Immigrants | Panama | 41.8 /100 | #183 | Average 2.4% |
| Sri Lankans | 41.8 /100 | #184 | Average 2.4% |
| Nigerians | 41.0 /100 | #185 | Average 2.4% |
| Immigrants | Bosnia and Herzegovina | 40.4 /100 | #186 | Average 2.4% |
| Immigrants | Colombia | 34.0 /100 | #187 | Fair 2.4% |
| Hmong | 33.0 /100 | #188 | Fair 2.4% |
| U.S. Virgin Islanders | 31.8 /100 | #189 | Fair 2.4% |
| French | 31.7 /100 | #190 | Fair 2.4% |
| Immigrants | Africa | 30.0 /100 | #191 | Fair 2.4% |
| Immigrants | Sudan | 29.8 /100 | #192 | Fair 2.4% |
| Uruguayans | 29.7 /100 | #193 | Fair 2.4% |
| Panamanians | 29.6 /100 | #194 | Fair 2.4% |