Immigrants from Uganda vs Dutch Single Father Households
COMPARE
Immigrants from Uganda
Dutch
Single Father Households
Single Father Households Comparison
Immigrants from Uganda
Dutch
2.4%
SINGLE FATHER HOUSEHOLDS
26.0/ 100
METRIC RATING
201st/ 347
METRIC RANK
2.4%
SINGLE FATHER HOUSEHOLDS
14.3/ 100
METRIC RATING
217th/ 347
METRIC RANK
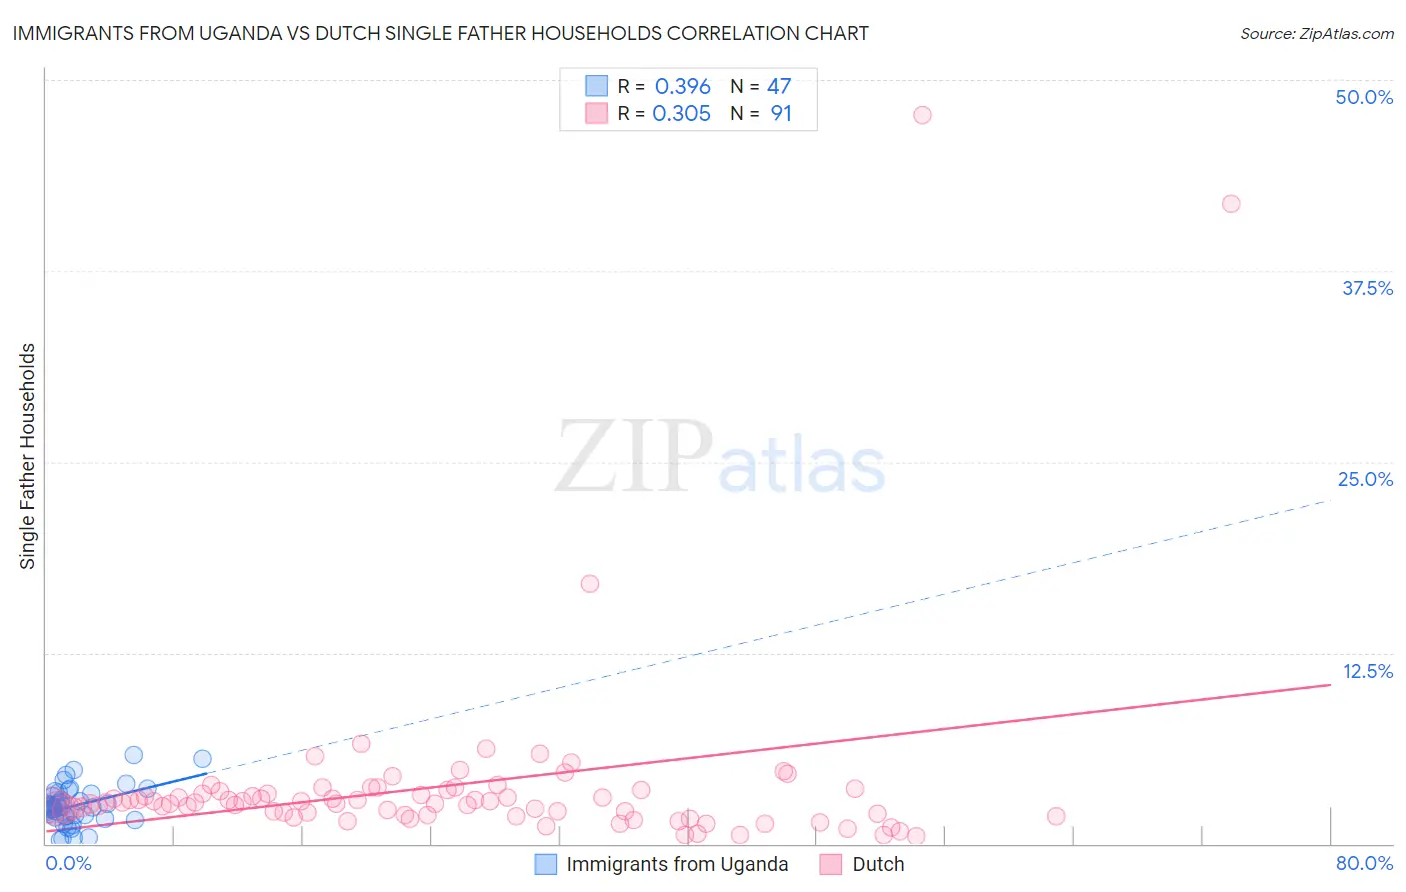
Immigrants from Uganda vs Dutch Single Father Households Correlation Chart
The statistical analysis conducted on geographies consisting of 125,685,639 people shows a mild positive correlation between the proportion of Immigrants from Uganda and percentage of single father households in the United States with a correlation coefficient (R) of 0.396 and weighted average of 2.4%. Similarly, the statistical analysis conducted on geographies consisting of 541,429,246 people shows a mild positive correlation between the proportion of Dutch and percentage of single father households in the United States with a correlation coefficient (R) of 0.305 and weighted average of 2.4%, a difference of 1.3%.
Single Father Households Correlation Summary
| Measurement | Immigrants from Uganda | Dutch |
| Minimum | 0.24% | 0.50% |
| Maximum | 5.8% | 47.7% |
| Range | 5.5% | 47.2% |
| Mean | 2.5% | 3.8% |
| Median | 2.4% | 2.7% |
| Interquartile 25% (IQ1) | 1.8% | 1.9% |
| Interquartile 75% (IQ3) | 3.2% | 3.4% |
| Interquartile Range (IQR) | 1.5% | 1.5% |
| Standard Deviation (Sample) | 1.2% | 6.5% |
| Standard Deviation (Population) | 1.2% | 6.5% |
Demographics Similar to Immigrants from Uganda and Dutch by Single Father Households
In terms of single father households, the demographic groups most similar to Immigrants from Uganda are German Russian (2.4%, a difference of 0.030%), Immigrants from Vietnam (2.4%, a difference of 0.10%), Peruvian (2.4%, a difference of 0.10%), French Canadian (2.4%, a difference of 0.13%), and Ecuadorian (2.4%, a difference of 0.15%). Similarly, the demographic groups most similar to Dutch are Immigrants from Ecuador (2.4%, a difference of 0.090%), Immigrants from Ethiopia (2.4%, a difference of 0.13%), Sudanese (2.4%, a difference of 0.20%), Immigrants from South Eastern Asia (2.4%, a difference of 0.22%), and Ethiopian (2.4%, a difference of 0.32%).
| Demographics | Rating | Rank | Single Father Households |
| Immigrants | Vietnam | 27.1 /100 | #199 | Fair 2.4% |
| Peruvians | 27.1 /100 | #200 | Fair 2.4% |
| Immigrants | Uganda | 26.0 /100 | #201 | Fair 2.4% |
| German Russians | 25.7 /100 | #202 | Fair 2.4% |
| French Canadians | 24.7 /100 | #203 | Fair 2.4% |
| Ecuadorians | 24.5 /100 | #204 | Fair 2.4% |
| Immigrants | Afghanistan | 24.2 /100 | #205 | Fair 2.4% |
| Koreans | 24.1 /100 | #206 | Fair 2.4% |
| Whites/Caucasians | 22.6 /100 | #207 | Fair 2.4% |
| Immigrants | Kenya | 20.3 /100 | #208 | Fair 2.4% |
| Immigrants | Peru | 19.3 /100 | #209 | Poor 2.4% |
| Immigrants | Costa Rica | 19.2 /100 | #210 | Poor 2.4% |
| Immigrants | Nigeria | 18.7 /100 | #211 | Poor 2.4% |
| Finns | 18.3 /100 | #212 | Poor 2.4% |
| Norwegians | 17.1 /100 | #213 | Poor 2.4% |
| Ethiopians | 16.6 /100 | #214 | Poor 2.4% |
| Immigrants | South Eastern Asia | 15.9 /100 | #215 | Poor 2.4% |
| Immigrants | Ecuador | 14.9 /100 | #216 | Poor 2.4% |
| Dutch | 14.3 /100 | #217 | Poor 2.4% |
| Immigrants | Ethiopia | 13.4 /100 | #218 | Poor 2.4% |
| Sudanese | 13.0 /100 | #219 | Poor 2.4% |