Spanish American vs Nigerian Births to Unmarried Women
COMPARE
Spanish American
Nigerian
Births to Unmarried Women
Births to Unmarried Women Comparison
Spanish Americans
Nigerians
38.6%
BIRTHS TO UNMARRIED WOMEN
0.0/ 100
METRIC RATING
299th/ 347
METRIC RANK
35.3%
BIRTHS TO UNMARRIED WOMEN
0.7/ 100
METRIC RATING
246th/ 347
METRIC RANK
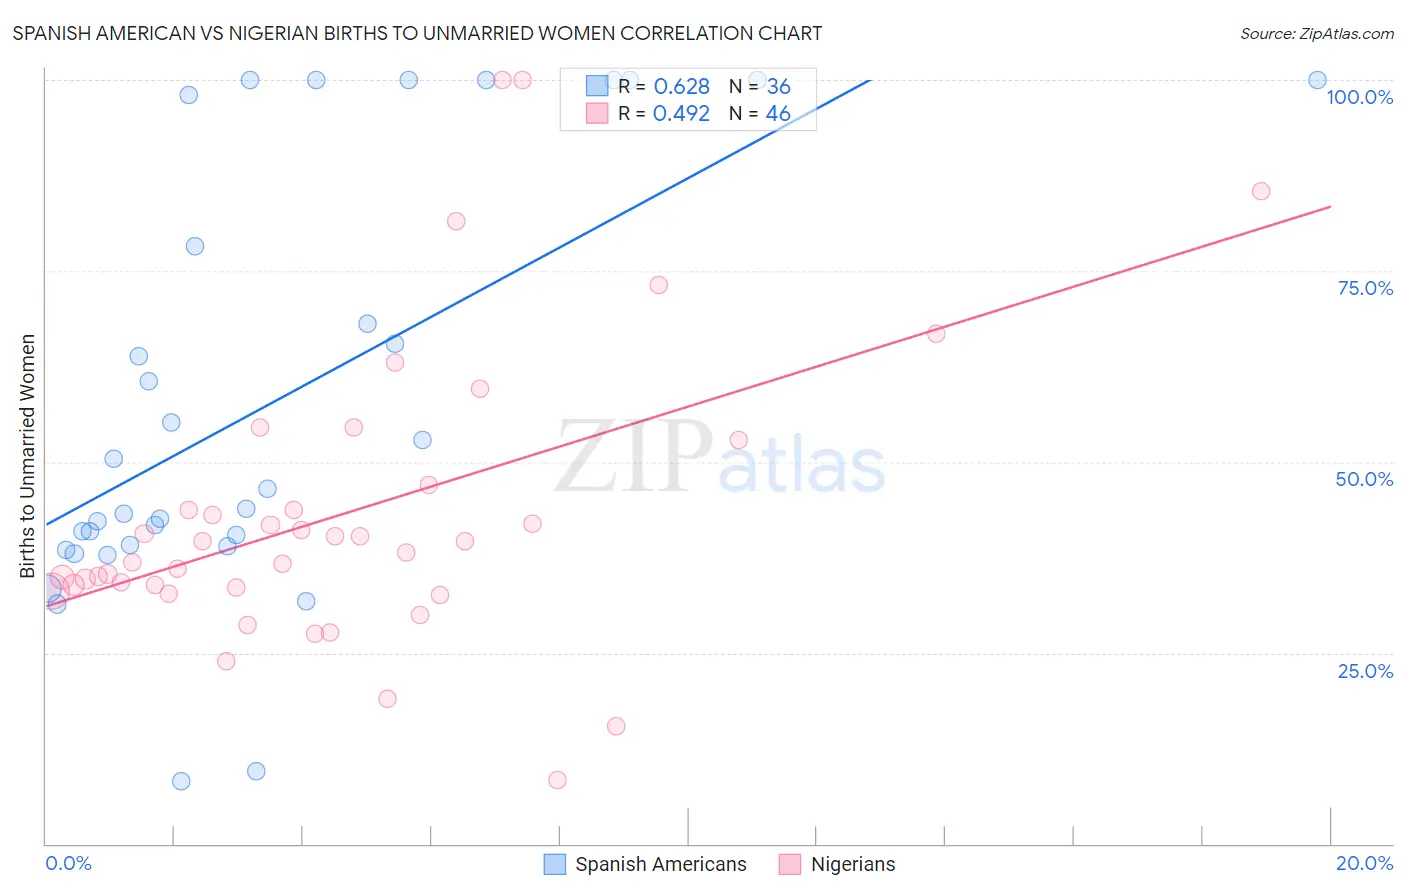
Spanish American vs Nigerian Births to Unmarried Women Correlation Chart
The statistical analysis conducted on geographies consisting of 101,589,972 people shows a significant positive correlation between the proportion of Spanish Americans and percentage of births to unmarried women in the United States with a correlation coefficient (R) of 0.628 and weighted average of 38.6%. Similarly, the statistical analysis conducted on geographies consisting of 318,352,588 people shows a moderate positive correlation between the proportion of Nigerians and percentage of births to unmarried women in the United States with a correlation coefficient (R) of 0.492 and weighted average of 35.3%, a difference of 9.1%.
Births to Unmarried Women Correlation Summary
| Measurement | Spanish American | Nigerian |
| Minimum | 8.2% | 8.3% |
| Maximum | 100.0% | 100.0% |
| Range | 91.8% | 91.7% |
| Mean | 57.8% | 43.4% |
| Median | 45.1% | 38.8% |
| Interquartile 25% (IQ1) | 39.1% | 33.6% |
| Interquartile 75% (IQ3) | 88.1% | 46.9% |
| Interquartile Range (IQR) | 49.1% | 13.3% |
| Standard Deviation (Sample) | 28.0% | 19.5% |
| Standard Deviation (Population) | 27.6% | 19.3% |
Similar Demographics by Births to Unmarried Women
Demographics Similar to Spanish Americans by Births to Unmarried Women
In terms of births to unmarried women, the demographic groups most similar to Spanish Americans are Immigrants from West Indies (38.6%, a difference of 0.060%), Haitian (38.6%, a difference of 0.070%), Jamaican (38.5%, a difference of 0.20%), Honduran (38.7%, a difference of 0.31%), and Dutch West Indian (38.4%, a difference of 0.40%).
| Demographics | Rating | Rank | Births to Unmarried Women |
| Blackfeet | 0.0 /100 | #292 | Tragic 37.9% |
| Immigrants | Nicaragua | 0.0 /100 | #293 | Tragic 38.0% |
| British West Indians | 0.0 /100 | #294 | Tragic 38.0% |
| Iroquois | 0.0 /100 | #295 | Tragic 38.2% |
| Alaska Natives | 0.0 /100 | #296 | Tragic 38.3% |
| Dutch West Indians | 0.0 /100 | #297 | Tragic 38.4% |
| Jamaicans | 0.0 /100 | #298 | Tragic 38.5% |
| Spanish Americans | 0.0 /100 | #299 | Tragic 38.6% |
| Immigrants | West Indies | 0.0 /100 | #300 | Tragic 38.6% |
| Haitians | 0.0 /100 | #301 | Tragic 38.6% |
| Hondurans | 0.0 /100 | #302 | Tragic 38.7% |
| Immigrants | Jamaica | 0.0 /100 | #303 | Tragic 38.8% |
| Yaqui | 0.0 /100 | #304 | Tragic 38.8% |
| Immigrants | Haiti | 0.0 /100 | #305 | Tragic 38.9% |
| Central American Indians | 0.0 /100 | #306 | Tragic 39.0% |
Demographics Similar to Nigerians by Births to Unmarried Women
In terms of births to unmarried women, the demographic groups most similar to Nigerians are Shoshone (35.3%, a difference of 0.11%), Immigrants from Nigeria (35.4%, a difference of 0.21%), Guyanese (35.2%, a difference of 0.45%), Japanese (35.2%, a difference of 0.51%), and Nonimmigrants (35.5%, a difference of 0.54%).
| Demographics | Rating | Rank | Births to Unmarried Women |
| Sierra Leoneans | 1.4 /100 | #239 | Tragic 34.9% |
| Immigrants | Middle Africa | 1.2 /100 | #240 | Tragic 34.9% |
| Immigrants | Guyana | 1.2 /100 | #241 | Tragic 35.0% |
| Indonesians | 1.2 /100 | #242 | Tragic 35.0% |
| Japanese | 0.9 /100 | #243 | Tragic 35.2% |
| Guyanese | 0.9 /100 | #244 | Tragic 35.2% |
| Shoshone | 0.8 /100 | #245 | Tragic 35.3% |
| Nigerians | 0.7 /100 | #246 | Tragic 35.3% |
| Immigrants | Nigeria | 0.7 /100 | #247 | Tragic 35.4% |
| Immigrants | Nonimmigrants | 0.6 /100 | #248 | Tragic 35.5% |
| Bermudans | 0.6 /100 | #249 | Tragic 35.5% |
| Mexican American Indians | 0.4 /100 | #250 | Tragic 35.7% |
| Immigrants | Western Africa | 0.3 /100 | #251 | Tragic 36.0% |
| Salvadorans | 0.3 /100 | #252 | Tragic 36.0% |
| Immigrants | Portugal | 0.2 /100 | #253 | Tragic 36.2% |