Immigrants from Uganda vs Immigrants from Eastern Africa Births to Unmarried Women
COMPARE
Immigrants from Uganda
Immigrants from Eastern Africa
Births to Unmarried Women
Births to Unmarried Women Comparison
Immigrants from Uganda
Immigrants from Eastern Africa
30.5%
BIRTHS TO UNMARRIED WOMEN
82.6/ 100
METRIC RATING
143rd/ 347
METRIC RANK
31.0%
BIRTHS TO UNMARRIED WOMEN
72.1/ 100
METRIC RATING
157th/ 347
METRIC RANK
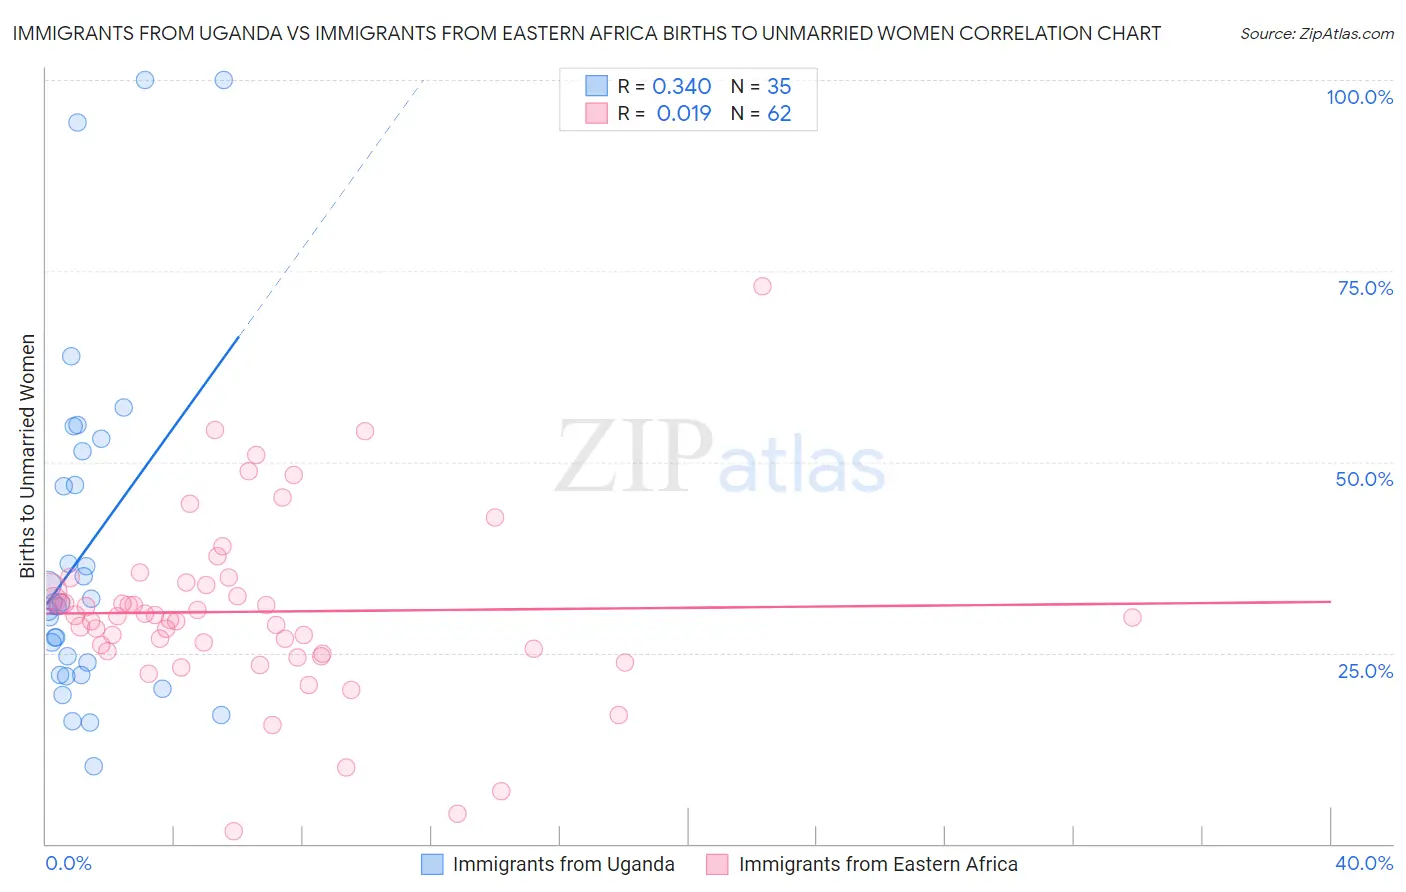
Immigrants from Uganda vs Immigrants from Eastern Africa Births to Unmarried Women Correlation Chart
The statistical analysis conducted on geographies consisting of 123,239,709 people shows a mild positive correlation between the proportion of Immigrants from Uganda and percentage of births to unmarried women in the United States with a correlation coefficient (R) of 0.340 and weighted average of 30.5%. Similarly, the statistical analysis conducted on geographies consisting of 336,393,079 people shows no correlation between the proportion of Immigrants from Eastern Africa and percentage of births to unmarried women in the United States with a correlation coefficient (R) of 0.019 and weighted average of 31.0%, a difference of 1.5%.
Births to Unmarried Women Correlation Summary
| Measurement | Immigrants from Uganda | Immigrants from Eastern Africa |
| Minimum | 10.2% | 1.6% |
| Maximum | 100.0% | 73.0% |
| Range | 89.8% | 71.4% |
| Mean | 38.4% | 30.4% |
| Median | 31.6% | 29.8% |
| Interquartile 25% (IQ1) | 22.1% | 25.2% |
| Interquartile 75% (IQ3) | 51.4% | 33.8% |
| Interquartile Range (IQR) | 29.3% | 8.6% |
| Standard Deviation (Sample) | 22.8% | 11.7% |
| Standard Deviation (Population) | 22.5% | 11.6% |
Demographics Similar to Immigrants from Uganda and Immigrants from Eastern Africa by Births to Unmarried Women
In terms of births to unmarried women, the demographic groups most similar to Immigrants from Uganda are South African (30.5%, a difference of 0.020%), Czech (30.5%, a difference of 0.070%), Pakistani (30.5%, a difference of 0.080%), Swiss (30.5%, a difference of 0.10%), and Immigrants from North America (30.6%, a difference of 0.17%). Similarly, the demographic groups most similar to Immigrants from Eastern Africa are Carpatho Rusyn (30.9%, a difference of 0.17%), Immigrants from Bangladesh (30.9%, a difference of 0.22%), Austrian (31.0%, a difference of 0.27%), Immigrants from England (31.1%, a difference of 0.32%), and Immigrants from Western Europe (31.1%, a difference of 0.33%).
| Demographics | Rating | Rank | Births to Unmarried Women |
| Swiss | 83.1 /100 | #140 | Excellent 30.5% |
| Pakistanis | 83.0 /100 | #141 | Excellent 30.5% |
| South Africans | 82.7 /100 | #142 | Excellent 30.5% |
| Immigrants | Uganda | 82.6 /100 | #143 | Excellent 30.5% |
| Czechs | 82.1 /100 | #144 | Excellent 30.5% |
| Immigrants | North America | 81.5 /100 | #145 | Excellent 30.6% |
| Northern Europeans | 81.4 /100 | #146 | Excellent 30.6% |
| Immigrants | Oceania | 81.2 /100 | #147 | Excellent 30.6% |
| Chileans | 79.1 /100 | #148 | Good 30.7% |
| Serbians | 78.8 /100 | #149 | Good 30.7% |
| Somalis | 77.8 /100 | #150 | Good 30.7% |
| Italians | 77.0 /100 | #151 | Good 30.8% |
| Poles | 76.2 /100 | #152 | Good 30.8% |
| British | 76.0 /100 | #153 | Good 30.8% |
| Yugoslavians | 75.1 /100 | #154 | Good 30.8% |
| Immigrants | Bangladesh | 73.9 /100 | #155 | Good 30.9% |
| Carpatho Rusyns | 73.5 /100 | #156 | Good 30.9% |
| Immigrants | Eastern Africa | 72.1 /100 | #157 | Good 31.0% |
| Austrians | 69.9 /100 | #158 | Good 31.0% |
| Immigrants | England | 69.4 /100 | #159 | Good 31.1% |
| Immigrants | Western Europe | 69.3 /100 | #160 | Good 31.1% |