Immigrants from Trinidad and Tobago vs Immigrants from Bolivia Births to Unmarried Women
COMPARE
Immigrants from Trinidad and Tobago
Immigrants from Bolivia
Births to Unmarried Women
Births to Unmarried Women Comparison
Immigrants from Trinidad and Tobago
Immigrants from Bolivia
36.3%
BIRTHS TO UNMARRIED WOMEN
0.2/ 100
METRIC RATING
256th/ 347
METRIC RANK
28.6%
BIRTHS TO UNMARRIED WOMEN
98.5/ 100
METRIC RATING
74th/ 347
METRIC RANK
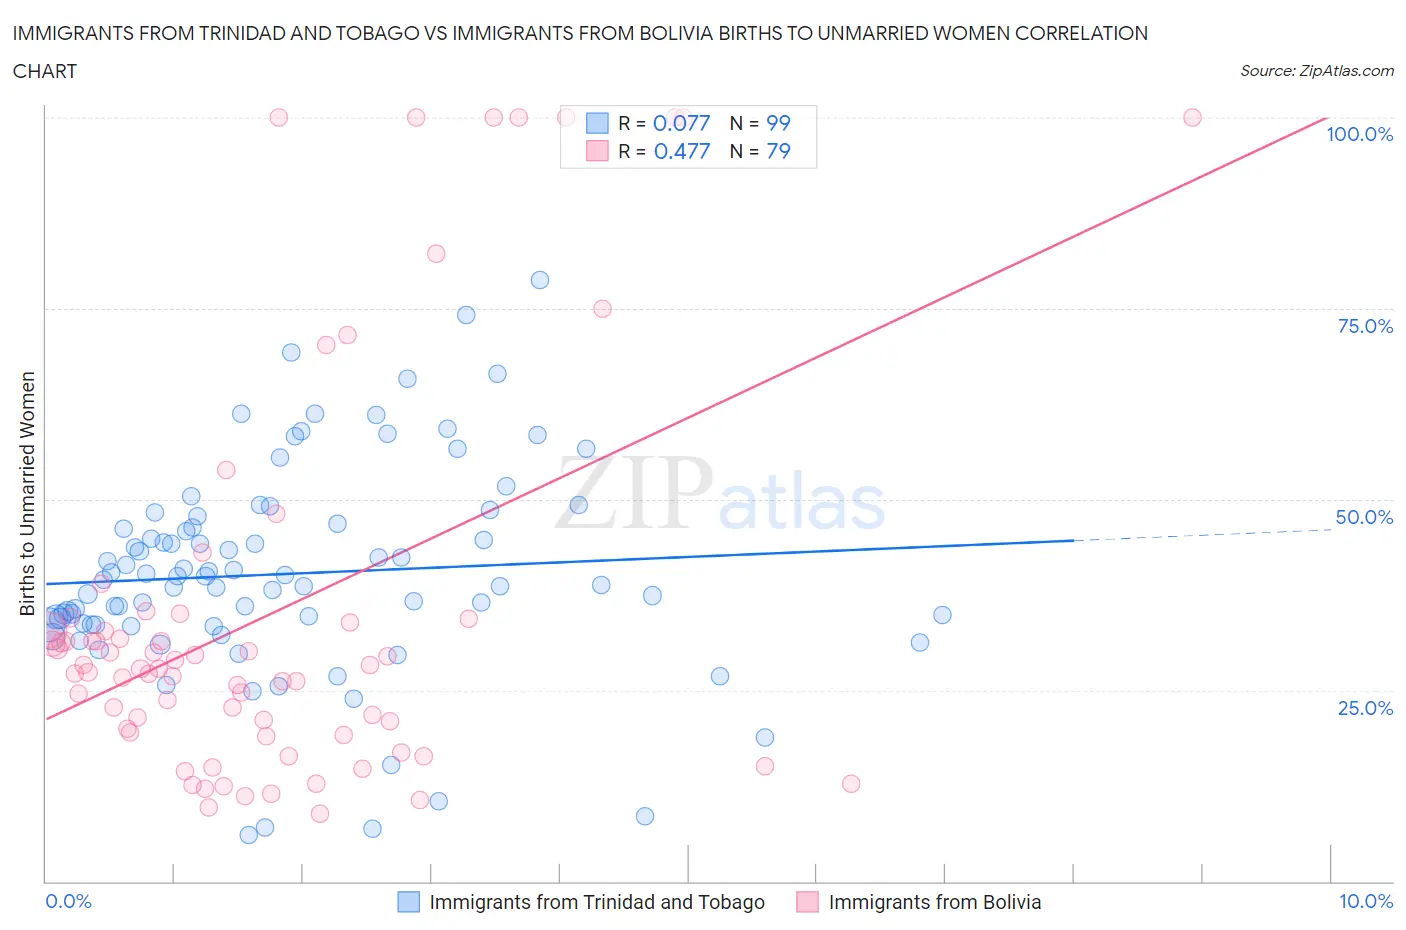
Immigrants from Trinidad and Tobago vs Immigrants from Bolivia Births to Unmarried Women Correlation Chart
The statistical analysis conducted on geographies consisting of 215,338,343 people shows a slight positive correlation between the proportion of Immigrants from Trinidad and Tobago and percentage of births to unmarried women in the United States with a correlation coefficient (R) of 0.077 and weighted average of 36.3%. Similarly, the statistical analysis conducted on geographies consisting of 153,801,306 people shows a moderate positive correlation between the proportion of Immigrants from Bolivia and percentage of births to unmarried women in the United States with a correlation coefficient (R) of 0.477 and weighted average of 28.6%, a difference of 27.1%.
Births to Unmarried Women Correlation Summary
| Measurement | Immigrants from Trinidad and Tobago | Immigrants from Bolivia |
| Minimum | 6.1% | 8.9% |
| Maximum | 78.7% | 100.0% |
| Range | 72.6% | 91.1% |
| Mean | 40.3% | 35.2% |
| Median | 39.5% | 27.9% |
| Interquartile 25% (IQ1) | 33.6% | 19.4% |
| Interquartile 75% (IQ3) | 46.8% | 34.4% |
| Interquartile Range (IQR) | 13.2% | 15.0% |
| Standard Deviation (Sample) | 13.7% | 25.9% |
| Standard Deviation (Population) | 13.7% | 25.8% |
Similar Demographics by Births to Unmarried Women
Demographics Similar to Immigrants from Trinidad and Tobago by Births to Unmarried Women
In terms of births to unmarried women, the demographic groups most similar to Immigrants from Trinidad and Tobago are Chickasaw (36.3%, a difference of 0.0%), Immigrants from Grenada (36.3%, a difference of 0.030%), Potawatomi (36.2%, a difference of 0.14%), American (36.4%, a difference of 0.31%), and Immigrants from Portugal (36.2%, a difference of 0.36%).
| Demographics | Rating | Rank | Births to Unmarried Women |
| Bermudans | 0.6 /100 | #249 | Tragic 35.5% |
| Mexican American Indians | 0.4 /100 | #250 | Tragic 35.7% |
| Immigrants | Western Africa | 0.3 /100 | #251 | Tragic 36.0% |
| Salvadorans | 0.3 /100 | #252 | Tragic 36.0% |
| Immigrants | Portugal | 0.2 /100 | #253 | Tragic 36.2% |
| Potawatomi | 0.2 /100 | #254 | Tragic 36.2% |
| Chickasaw | 0.2 /100 | #255 | Tragic 36.3% |
| Immigrants | Trinidad and Tobago | 0.2 /100 | #256 | Tragic 36.3% |
| Immigrants | Grenada | 0.2 /100 | #257 | Tragic 36.3% |
| Americans | 0.2 /100 | #258 | Tragic 36.4% |
| Immigrants | El Salvador | 0.2 /100 | #259 | Tragic 36.4% |
| Ottawa | 0.2 /100 | #260 | Tragic 36.5% |
| Trinidadians and Tobagonians | 0.2 /100 | #261 | Tragic 36.5% |
| French American Indians | 0.1 /100 | #262 | Tragic 36.6% |
| Nicaraguans | 0.1 /100 | #263 | Tragic 36.6% |
Demographics Similar to Immigrants from Bolivia by Births to Unmarried Women
In terms of births to unmarried women, the demographic groups most similar to Immigrants from Bolivia are Albanian (28.5%, a difference of 0.020%), Immigrants from Sweden (28.5%, a difference of 0.070%), Immigrants from Switzerland (28.6%, a difference of 0.090%), Israeli (28.6%, a difference of 0.10%), and Jordanian (28.5%, a difference of 0.13%).
| Demographics | Rating | Rank | Births to Unmarried Women |
| Palestinians | 98.7 /100 | #67 | Exceptional 28.4% |
| Immigrants | Europe | 98.7 /100 | #68 | Exceptional 28.4% |
| Bolivians | 98.7 /100 | #69 | Exceptional 28.5% |
| Laotians | 98.6 /100 | #70 | Exceptional 28.5% |
| Jordanians | 98.5 /100 | #71 | Exceptional 28.5% |
| Immigrants | Sweden | 98.5 /100 | #72 | Exceptional 28.5% |
| Albanians | 98.5 /100 | #73 | Exceptional 28.5% |
| Immigrants | Bolivia | 98.5 /100 | #74 | Exceptional 28.6% |
| Immigrants | Switzerland | 98.4 /100 | #75 | Exceptional 28.6% |
| Israelis | 98.4 /100 | #76 | Exceptional 28.6% |
| Immigrants | Northern Europe | 98.3 /100 | #77 | Exceptional 28.6% |
| Zimbabweans | 98.2 /100 | #78 | Exceptional 28.7% |
| Danes | 98.2 /100 | #79 | Exceptional 28.7% |
| Immigrants | Afghanistan | 98.1 /100 | #80 | Exceptional 28.7% |
| Immigrants | Austria | 98.1 /100 | #81 | Exceptional 28.7% |