British vs Immigrants from Bosnia and Herzegovina Births to Unmarried Women
COMPARE
British
Immigrants from Bosnia and Herzegovina
Births to Unmarried Women
Births to Unmarried Women Comparison
British
Immigrants from Bosnia and Herzegovina
30.8%
BIRTHS TO UNMARRIED WOMEN
76.0/ 100
METRIC RATING
153rd/ 347
METRIC RANK
30.3%
BIRTHS TO UNMARRIED WOMEN
85.7/ 100
METRIC RATING
130th/ 347
METRIC RANK
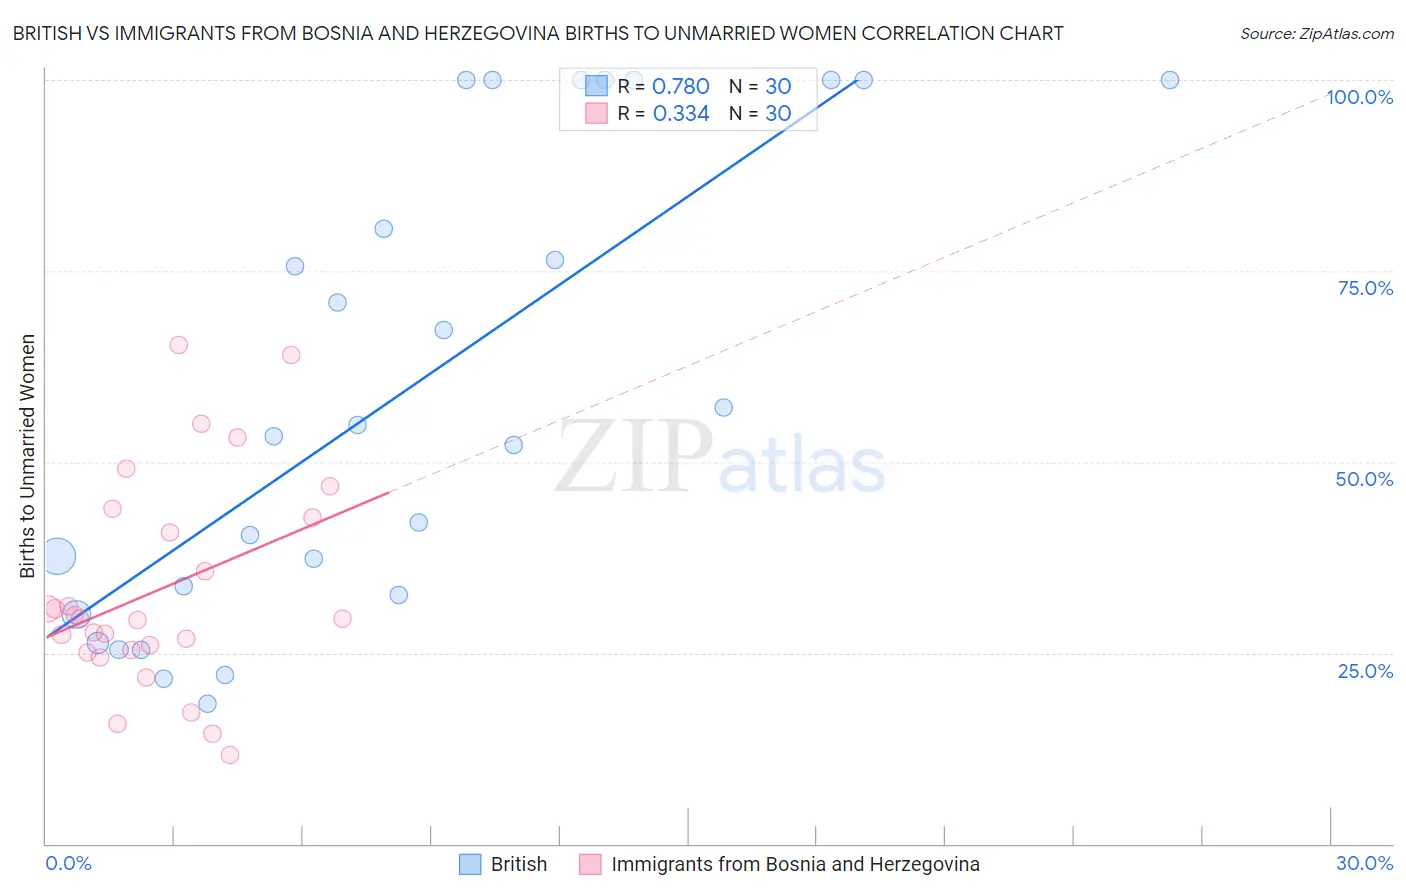
British vs Immigrants from Bosnia and Herzegovina Births to Unmarried Women Correlation Chart
The statistical analysis conducted on geographies consisting of 478,658,023 people shows a strong positive correlation between the proportion of British and percentage of births to unmarried women in the United States with a correlation coefficient (R) of 0.780 and weighted average of 30.8%. Similarly, the statistical analysis conducted on geographies consisting of 151,670,112 people shows a mild positive correlation between the proportion of Immigrants from Bosnia and Herzegovina and percentage of births to unmarried women in the United States with a correlation coefficient (R) of 0.334 and weighted average of 30.3%, a difference of 1.6%.
Births to Unmarried Women Correlation Summary
| Measurement | British | Immigrants from Bosnia and Herzegovina |
| Minimum | 18.3% | 11.7% |
| Maximum | 100.0% | 65.3% |
| Range | 81.7% | 53.6% |
| Mean | 59.4% | 33.3% |
| Median | 54.1% | 29.5% |
| Interquartile 25% (IQ1) | 32.5% | 25.3% |
| Interquartile 75% (IQ3) | 100.0% | 42.7% |
| Interquartile Range (IQR) | 67.5% | 17.4% |
| Standard Deviation (Sample) | 30.1% | 13.8% |
| Standard Deviation (Population) | 29.6% | 13.6% |
Similar Demographics by Births to Unmarried Women
Demographics Similar to British by Births to Unmarried Women
In terms of births to unmarried women, the demographic groups most similar to British are Polish (30.8%, a difference of 0.020%), Yugoslavian (30.8%, a difference of 0.12%), Italian (30.8%, a difference of 0.13%), Somali (30.7%, a difference of 0.24%), and Immigrants from Bangladesh (30.9%, a difference of 0.27%).
| Demographics | Rating | Rank | Births to Unmarried Women |
| Northern Europeans | 81.4 /100 | #146 | Excellent 30.6% |
| Immigrants | Oceania | 81.2 /100 | #147 | Excellent 30.6% |
| Chileans | 79.1 /100 | #148 | Good 30.7% |
| Serbians | 78.8 /100 | #149 | Good 30.7% |
| Somalis | 77.8 /100 | #150 | Good 30.7% |
| Italians | 77.0 /100 | #151 | Good 30.8% |
| Poles | 76.2 /100 | #152 | Good 30.8% |
| British | 76.0 /100 | #153 | Good 30.8% |
| Yugoslavians | 75.1 /100 | #154 | Good 30.8% |
| Immigrants | Bangladesh | 73.9 /100 | #155 | Good 30.9% |
| Carpatho Rusyns | 73.5 /100 | #156 | Good 30.9% |
| Immigrants | Eastern Africa | 72.1 /100 | #157 | Good 31.0% |
| Austrians | 69.9 /100 | #158 | Good 31.0% |
| Immigrants | England | 69.4 /100 | #159 | Good 31.1% |
| Immigrants | Western Europe | 69.3 /100 | #160 | Good 31.1% |
Demographics Similar to Immigrants from Bosnia and Herzegovina by Births to Unmarried Women
In terms of births to unmarried women, the demographic groups most similar to Immigrants from Bosnia and Herzegovina are Immigrants from Spain (30.3%, a difference of 0.010%), Immigrants from Zimbabwe (30.3%, a difference of 0.010%), Icelander (30.3%, a difference of 0.050%), New Zealander (30.3%, a difference of 0.050%), and Immigrants from Morocco (30.4%, a difference of 0.090%).
| Demographics | Rating | Rank | Births to Unmarried Women |
| Syrians | 88.2 /100 | #123 | Excellent 30.2% |
| Croatians | 88.0 /100 | #124 | Excellent 30.2% |
| Vietnamese | 87.7 /100 | #125 | Excellent 30.2% |
| Europeans | 87.2 /100 | #126 | Excellent 30.2% |
| Chinese | 87.1 /100 | #127 | Excellent 30.2% |
| Icelanders | 86.0 /100 | #128 | Excellent 30.3% |
| Immigrants | Spain | 85.8 /100 | #129 | Excellent 30.3% |
| Immigrants | Bosnia and Herzegovina | 85.7 /100 | #130 | Excellent 30.3% |
| Immigrants | Zimbabwe | 85.7 /100 | #131 | Excellent 30.3% |
| New Zealanders | 85.5 /100 | #132 | Excellent 30.3% |
| Immigrants | Morocco | 85.2 /100 | #133 | Excellent 30.4% |
| Immigrants | South Eastern Asia | 85.2 /100 | #134 | Excellent 30.4% |
| Brazilians | 84.8 /100 | #135 | Excellent 30.4% |
| Immigrants | Scotland | 84.6 /100 | #136 | Excellent 30.4% |
| Immigrants | Philippines | 83.9 /100 | #137 | Excellent 30.4% |