Immigrants from Caribbean vs Immigrants from Bosnia and Herzegovina Births to Unmarried Women
COMPARE
Immigrants from Caribbean
Immigrants from Bosnia and Herzegovina
Births to Unmarried Women
Births to Unmarried Women Comparison
Immigrants from Caribbean
Immigrants from Bosnia and Herzegovina
39.8%
BIRTHS TO UNMARRIED WOMEN
0.0/ 100
METRIC RATING
314th/ 347
METRIC RANK
30.3%
BIRTHS TO UNMARRIED WOMEN
85.7/ 100
METRIC RATING
130th/ 347
METRIC RANK
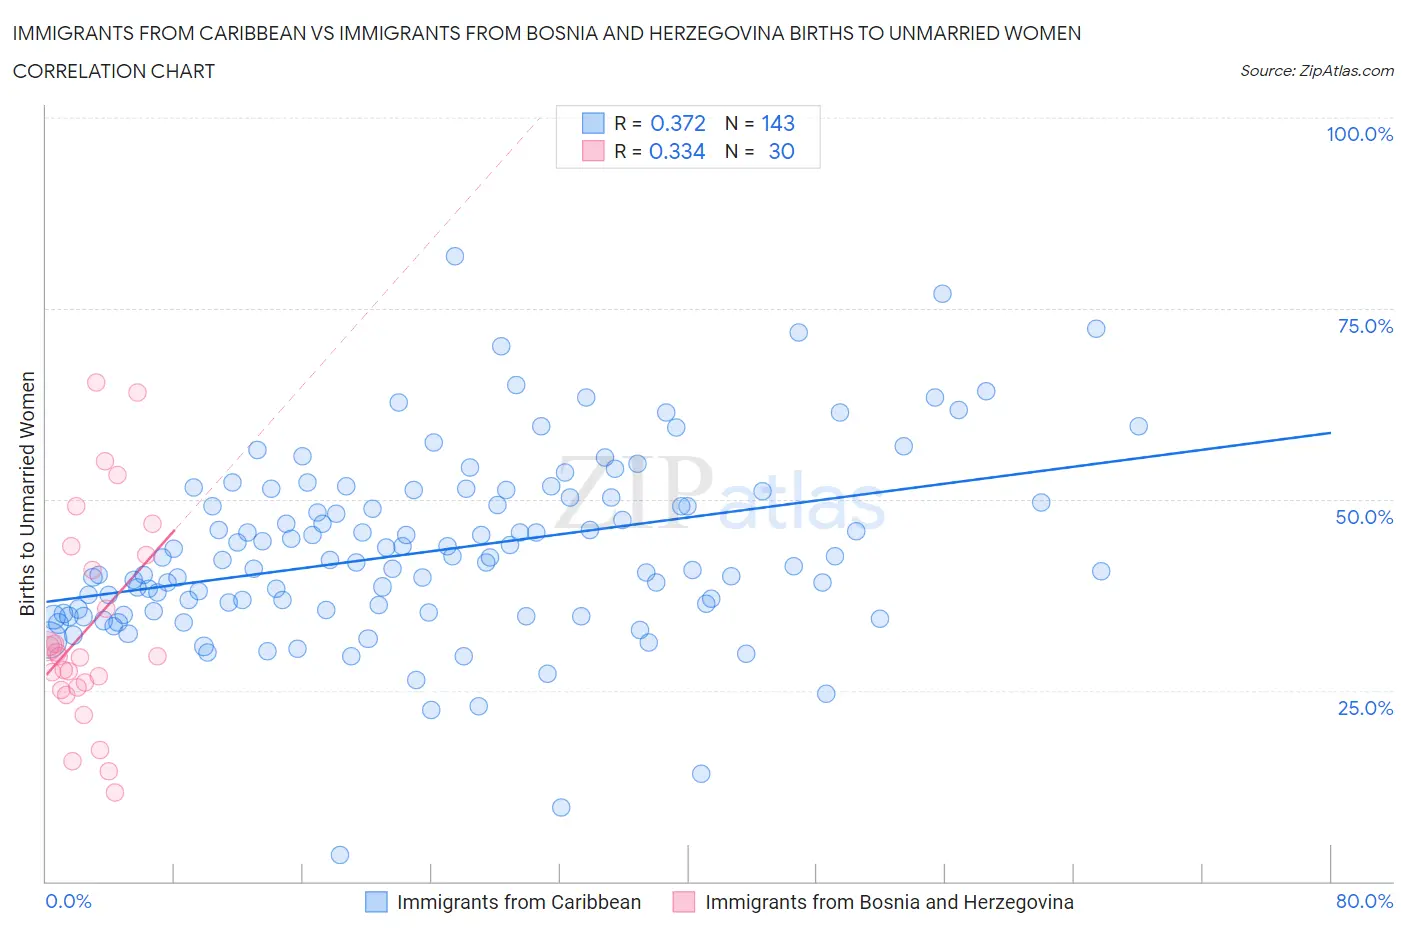
Immigrants from Caribbean vs Immigrants from Bosnia and Herzegovina Births to Unmarried Women Correlation Chart
The statistical analysis conducted on geographies consisting of 417,835,759 people shows a mild positive correlation between the proportion of Immigrants from Caribbean and percentage of births to unmarried women in the United States with a correlation coefficient (R) of 0.372 and weighted average of 39.8%. Similarly, the statistical analysis conducted on geographies consisting of 151,670,112 people shows a mild positive correlation between the proportion of Immigrants from Bosnia and Herzegovina and percentage of births to unmarried women in the United States with a correlation coefficient (R) of 0.334 and weighted average of 30.3%, a difference of 31.3%.
Births to Unmarried Women Correlation Summary
| Measurement | Immigrants from Caribbean | Immigrants from Bosnia and Herzegovina |
| Minimum | 3.4% | 11.7% |
| Maximum | 81.8% | 65.3% |
| Range | 78.4% | 53.6% |
| Mean | 43.3% | 33.3% |
| Median | 42.0% | 29.5% |
| Interquartile 25% (IQ1) | 35.4% | 25.3% |
| Interquartile 75% (IQ3) | 50.3% | 42.7% |
| Interquartile Range (IQR) | 15.0% | 17.4% |
| Standard Deviation (Sample) | 12.1% | 13.8% |
| Standard Deviation (Population) | 12.0% | 13.6% |
Similar Demographics by Births to Unmarried Women
Demographics Similar to Immigrants from Caribbean by Births to Unmarried Women
In terms of births to unmarried women, the demographic groups most similar to Immigrants from Caribbean are Dominican (39.8%, a difference of 0.040%), Apache (39.9%, a difference of 0.10%), African (39.7%, a difference of 0.29%), U.S. Virgin Islander (39.6%, a difference of 0.63%), and Immigrants from the Azores (39.6%, a difference of 0.65%).
| Demographics | Rating | Rank | Births to Unmarried Women |
| Immigrants | Honduras | 0.0 /100 | #307 | Tragic 39.3% |
| Aleuts | 0.0 /100 | #308 | Tragic 39.3% |
| Cubans | 0.0 /100 | #309 | Tragic 39.4% |
| Immigrants | Dominica | 0.0 /100 | #310 | Tragic 39.5% |
| Immigrants | Azores | 0.0 /100 | #311 | Tragic 39.6% |
| U.S. Virgin Islanders | 0.0 /100 | #312 | Tragic 39.6% |
| Africans | 0.0 /100 | #313 | Tragic 39.7% |
| Immigrants | Caribbean | 0.0 /100 | #314 | Tragic 39.8% |
| Dominicans | 0.0 /100 | #315 | Tragic 39.8% |
| Apache | 0.0 /100 | #316 | Tragic 39.9% |
| Immigrants | Dominican Republic | 0.0 /100 | #317 | Tragic 40.1% |
| Immigrants | Bahamas | 0.0 /100 | #318 | Tragic 40.1% |
| Yakama | 0.0 /100 | #319 | Tragic 40.3% |
| Crow | 0.0 /100 | #320 | Tragic 40.4% |
| Bahamians | 0.0 /100 | #321 | Tragic 40.8% |
Demographics Similar to Immigrants from Bosnia and Herzegovina by Births to Unmarried Women
In terms of births to unmarried women, the demographic groups most similar to Immigrants from Bosnia and Herzegovina are Immigrants from Spain (30.3%, a difference of 0.010%), Immigrants from Zimbabwe (30.3%, a difference of 0.010%), Icelander (30.3%, a difference of 0.050%), New Zealander (30.3%, a difference of 0.050%), and Immigrants from Morocco (30.4%, a difference of 0.090%).
| Demographics | Rating | Rank | Births to Unmarried Women |
| Syrians | 88.2 /100 | #123 | Excellent 30.2% |
| Croatians | 88.0 /100 | #124 | Excellent 30.2% |
| Vietnamese | 87.7 /100 | #125 | Excellent 30.2% |
| Europeans | 87.2 /100 | #126 | Excellent 30.2% |
| Chinese | 87.1 /100 | #127 | Excellent 30.2% |
| Icelanders | 86.0 /100 | #128 | Excellent 30.3% |
| Immigrants | Spain | 85.8 /100 | #129 | Excellent 30.3% |
| Immigrants | Bosnia and Herzegovina | 85.7 /100 | #130 | Excellent 30.3% |
| Immigrants | Zimbabwe | 85.7 /100 | #131 | Excellent 30.3% |
| New Zealanders | 85.5 /100 | #132 | Excellent 30.3% |
| Immigrants | Morocco | 85.2 /100 | #133 | Excellent 30.4% |
| Immigrants | South Eastern Asia | 85.2 /100 | #134 | Excellent 30.4% |
| Brazilians | 84.8 /100 | #135 | Excellent 30.4% |
| Immigrants | Scotland | 84.6 /100 | #136 | Excellent 30.4% |
| Immigrants | Philippines | 83.9 /100 | #137 | Excellent 30.4% |