Mexican vs Ugandan Married-couple Households
COMPARE
Mexican
Ugandan
Married-couple Households
Married-couple Households Comparison
Mexicans
Ugandans
47.1%
MARRIED-COUPLE HOUSEHOLDS
83.4/ 100
METRIC RATING
144th/ 347
METRIC RANK
43.8%
MARRIED-COUPLE HOUSEHOLDS
0.3/ 100
METRIC RATING
256th/ 347
METRIC RANK
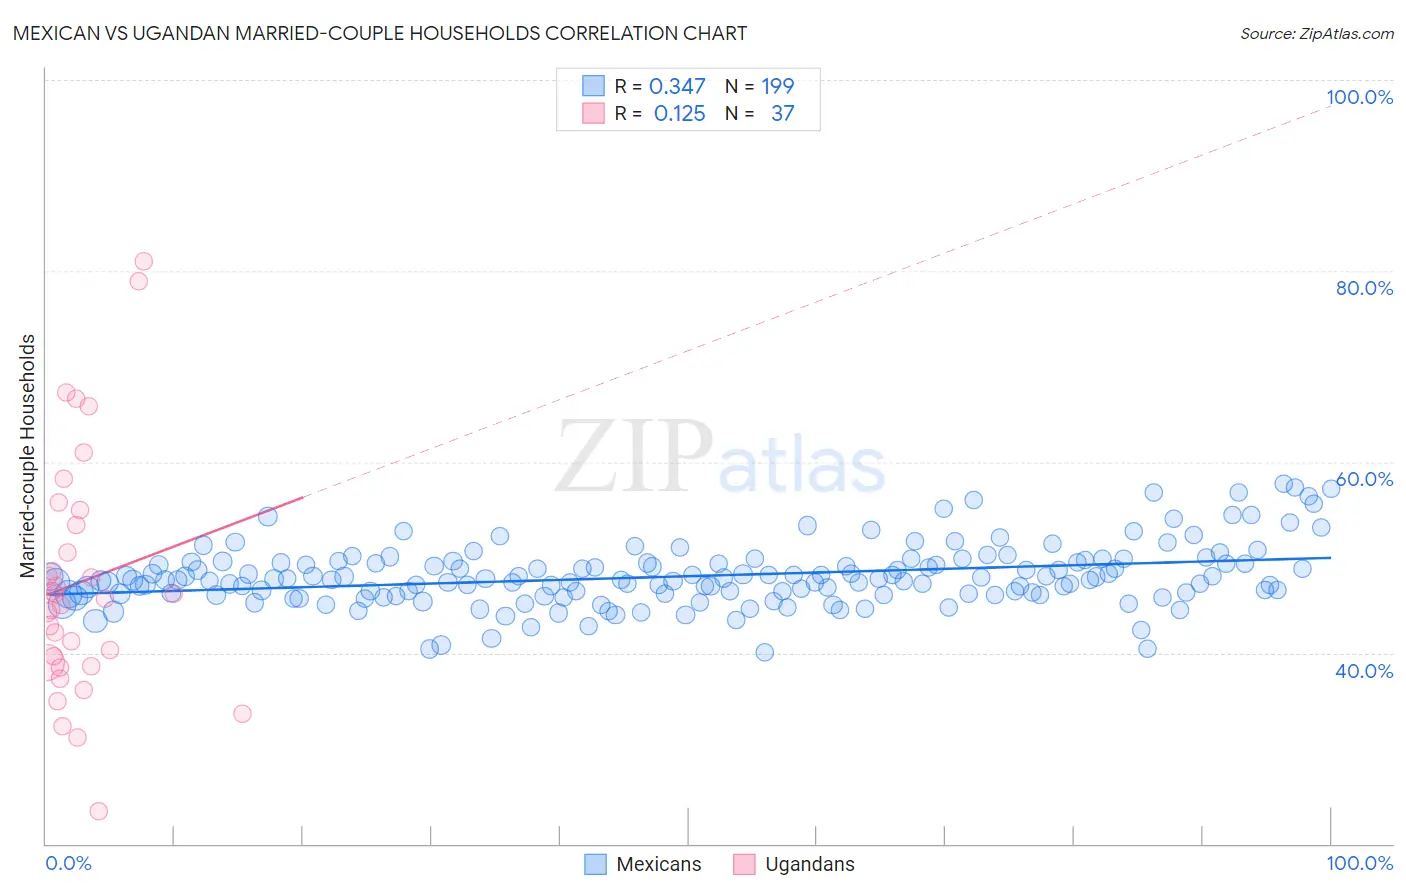
Mexican vs Ugandan Married-couple Households Correlation Chart
The statistical analysis conducted on geographies consisting of 560,704,291 people shows a mild positive correlation between the proportion of Mexicans and percentage of married-couple family households in the United States with a correlation coefficient (R) of 0.347 and weighted average of 47.1%. Similarly, the statistical analysis conducted on geographies consisting of 93,998,948 people shows a poor positive correlation between the proportion of Ugandans and percentage of married-couple family households in the United States with a correlation coefficient (R) of 0.125 and weighted average of 43.8%, a difference of 7.5%.
Married-couple Households Correlation Summary
| Measurement | Mexican | Ugandan |
| Minimum | 40.1% | 23.4% |
| Maximum | 57.7% | 81.0% |
| Range | 17.6% | 57.6% |
| Mean | 48.0% | 47.4% |
| Median | 47.6% | 45.6% |
| Interquartile 25% (IQ1) | 46.2% | 38.8% |
| Interquartile 75% (IQ3) | 49.4% | 54.2% |
| Interquartile Range (IQR) | 3.2% | 15.3% |
| Standard Deviation (Sample) | 3.2% | 12.7% |
| Standard Deviation (Population) | 3.2% | 12.5% |
Similar Demographics by Married-couple Households
Demographics Similar to Mexicans by Married-couple Households
In terms of married-couple households, the demographic groups most similar to Mexicans are Immigrants from Belarus (47.2%, a difference of 0.020%), Spaniard (47.2%, a difference of 0.050%), Spanish (47.2%, a difference of 0.070%), Costa Rican (47.2%, a difference of 0.070%), and Immigrants from Sweden (47.2%, a difference of 0.090%).
| Demographics | Rating | Rank | Married-couple Households |
| Immigrants | Malaysia | 85.2 /100 | #137 | Excellent 47.2% |
| Immigrants | Afghanistan | 85.1 /100 | #138 | Excellent 47.2% |
| Immigrants | Sweden | 84.7 /100 | #139 | Excellent 47.2% |
| Spanish | 84.5 /100 | #140 | Excellent 47.2% |
| Costa Ricans | 84.4 /100 | #141 | Excellent 47.2% |
| Spaniards | 84.1 /100 | #142 | Excellent 47.2% |
| Immigrants | Belarus | 83.8 /100 | #143 | Excellent 47.2% |
| Mexicans | 83.4 /100 | #144 | Excellent 47.1% |
| Slovenes | 81.7 /100 | #145 | Excellent 47.1% |
| Immigrants | Western Europe | 81.6 /100 | #146 | Excellent 47.1% |
| Immigrants | Syria | 81.6 /100 | #147 | Excellent 47.1% |
| Icelanders | 79.5 /100 | #148 | Good 47.0% |
| Paraguayans | 78.7 /100 | #149 | Good 47.0% |
| Immigrants | Russia | 77.6 /100 | #150 | Good 47.0% |
| Immigrants | Bulgaria | 76.8 /100 | #151 | Good 47.0% |
Demographics Similar to Ugandans by Married-couple Households
In terms of married-couple households, the demographic groups most similar to Ugandans are Shoshone (43.9%, a difference of 0.14%), Apache (43.9%, a difference of 0.16%), Blackfeet (43.8%, a difference of 0.16%), Central American Indian (43.8%, a difference of 0.20%), and Central American (43.9%, a difference of 0.21%).
| Demographics | Rating | Rank | Married-couple Households |
| Immigrants | Kenya | 0.4 /100 | #249 | Tragic 44.1% |
| French American Indians | 0.4 /100 | #250 | Tragic 44.1% |
| German Russians | 0.4 /100 | #251 | Tragic 44.0% |
| Seminole | 0.4 /100 | #252 | Tragic 44.0% |
| Central Americans | 0.3 /100 | #253 | Tragic 43.9% |
| Apache | 0.3 /100 | #254 | Tragic 43.9% |
| Shoshone | 0.3 /100 | #255 | Tragic 43.9% |
| Ugandans | 0.3 /100 | #256 | Tragic 43.8% |
| Blackfeet | 0.2 /100 | #257 | Tragic 43.8% |
| Central American Indians | 0.2 /100 | #258 | Tragic 43.8% |
| Iroquois | 0.2 /100 | #259 | Tragic 43.7% |
| Immigrants | Cameroon | 0.2 /100 | #260 | Tragic 43.7% |
| Alaskan Athabascans | 0.2 /100 | #261 | Tragic 43.6% |
| Vietnamese | 0.2 /100 | #262 | Tragic 43.6% |
| Cree | 0.1 /100 | #263 | Tragic 43.6% |