Immigrants from Sweden vs Maltese Single Mother Households
COMPARE
Immigrants from Sweden
Maltese
Single Mother Households
Single Mother Households Comparison
Immigrants from Sweden
Maltese
5.4%
SINGLE MOTHER HOUSEHOLDS
99.6/ 100
METRIC RATING
39th/ 347
METRIC RANK
5.2%
SINGLE MOTHER HOUSEHOLDS
99.9/ 100
METRIC RATING
20th/ 347
METRIC RANK
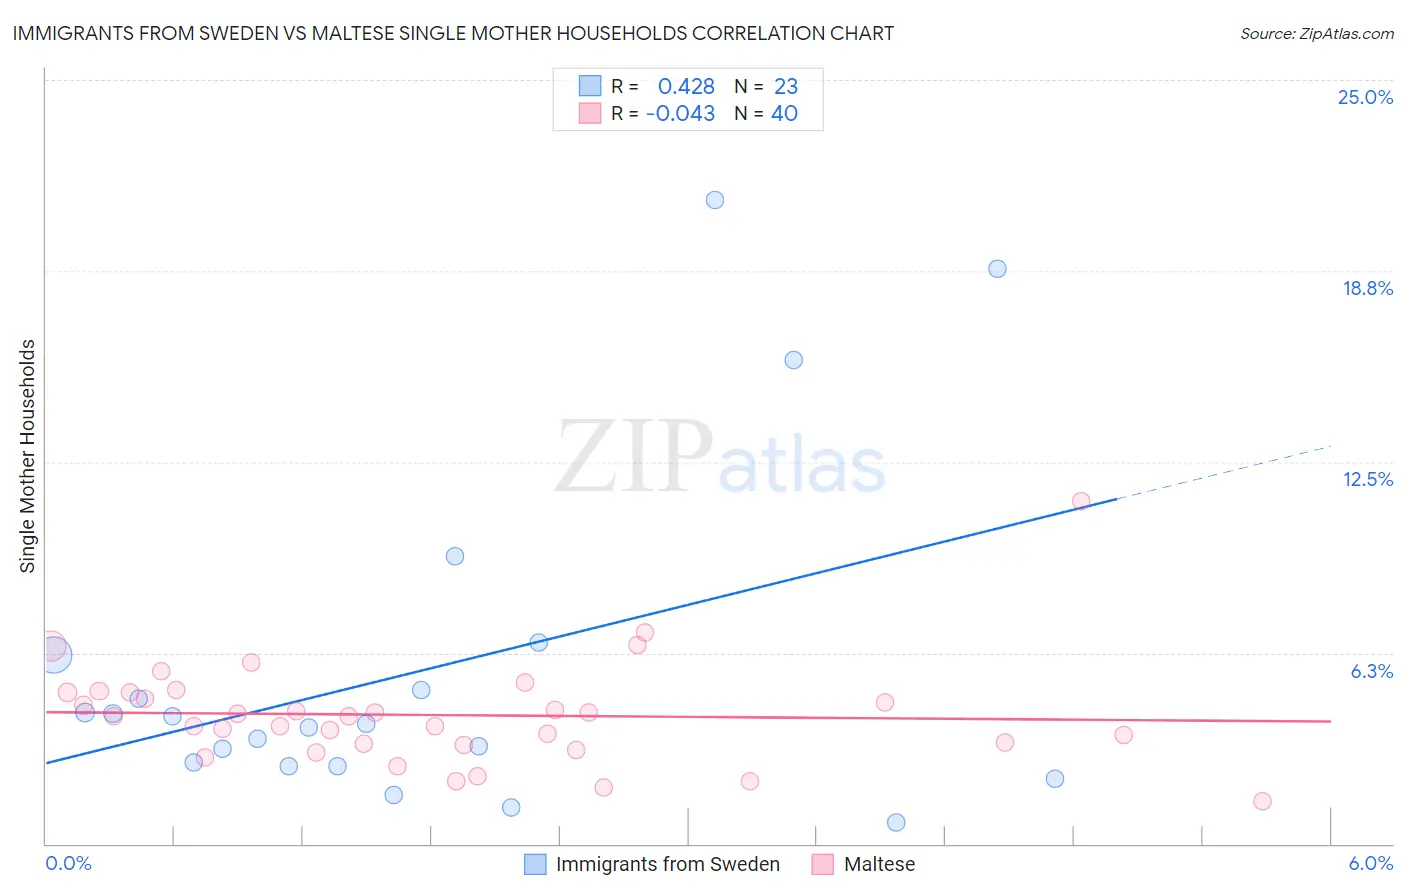
Immigrants from Sweden vs Maltese Single Mother Households Correlation Chart
The statistical analysis conducted on geographies consisting of 164,354,075 people shows a moderate positive correlation between the proportion of Immigrants from Sweden and percentage of single mother households in the United States with a correlation coefficient (R) of 0.428 and weighted average of 5.4%. Similarly, the statistical analysis conducted on geographies consisting of 126,155,970 people shows no correlation between the proportion of Maltese and percentage of single mother households in the United States with a correlation coefficient (R) of -0.043 and weighted average of 5.2%, a difference of 3.4%.
Single Mother Households Correlation Summary
| Measurement | Immigrants from Sweden | Maltese |
| Minimum | 0.71% | 1.4% |
| Maximum | 21.1% | 11.2% |
| Range | 20.3% | 9.8% |
| Mean | 5.7% | 4.2% |
| Median | 3.9% | 4.2% |
| Interquartile 25% (IQ1) | 2.5% | 3.3% |
| Interquartile 75% (IQ3) | 6.2% | 4.9% |
| Interquartile Range (IQR) | 3.7% | 1.7% |
| Standard Deviation (Sample) | 5.5% | 1.7% |
| Standard Deviation (Population) | 5.4% | 1.7% |
Demographics Similar to Immigrants from Sweden and Maltese by Single Mother Households
In terms of single mother households, the demographic groups most similar to Immigrants from Sweden are Immigrants from Serbia (5.4%, a difference of 0.14%), Immigrants from Belgium (5.3%, a difference of 0.58%), Immigrants from Czechoslovakia (5.3%, a difference of 0.72%), Immigrants from Northern Europe (5.3%, a difference of 0.92%), and Bulgarian (5.3%, a difference of 0.96%). Similarly, the demographic groups most similar to Maltese are Eastern European (5.2%, a difference of 0.060%), Chinese (5.2%, a difference of 0.47%), Thai (5.2%, a difference of 0.78%), Immigrants from Austria (5.2%, a difference of 0.83%), and Armenian (5.2%, a difference of 0.89%).
| Demographics | Rating | Rank | Single Mother Households |
| Chinese | 99.9 /100 | #19 | Exceptional 5.2% |
| Maltese | 99.9 /100 | #20 | Exceptional 5.2% |
| Eastern Europeans | 99.8 /100 | #21 | Exceptional 5.2% |
| Thais | 99.8 /100 | #22 | Exceptional 5.2% |
| Immigrants | Austria | 99.8 /100 | #23 | Exceptional 5.2% |
| Armenians | 99.8 /100 | #24 | Exceptional 5.2% |
| Immigrants | Japan | 99.8 /100 | #25 | Exceptional 5.2% |
| Immigrants | Lithuania | 99.8 /100 | #26 | Exceptional 5.3% |
| Bhutanese | 99.7 /100 | #27 | Exceptional 5.3% |
| Russians | 99.7 /100 | #28 | Exceptional 5.3% |
| Latvians | 99.7 /100 | #29 | Exceptional 5.3% |
| Burmese | 99.7 /100 | #30 | Exceptional 5.3% |
| Immigrants | Korea | 99.7 /100 | #31 | Exceptional 5.3% |
| Cambodians | 99.7 /100 | #32 | Exceptional 5.3% |
| Immigrants | Switzerland | 99.7 /100 | #33 | Exceptional 5.3% |
| Bulgarians | 99.7 /100 | #34 | Exceptional 5.3% |
| Immigrants | Northern Europe | 99.7 /100 | #35 | Exceptional 5.3% |
| Immigrants | Czechoslovakia | 99.7 /100 | #36 | Exceptional 5.3% |
| Immigrants | Belgium | 99.7 /100 | #37 | Exceptional 5.3% |
| Immigrants | Serbia | 99.6 /100 | #38 | Exceptional 5.4% |
| Immigrants | Sweden | 99.6 /100 | #39 | Exceptional 5.4% |