Immigrants from Sweden vs Immigrants from Nigeria Births to Unmarried Women
COMPARE
Immigrants from Sweden
Immigrants from Nigeria
Births to Unmarried Women
Births to Unmarried Women Comparison
Immigrants from Sweden
Immigrants from Nigeria
28.5%
BIRTHS TO UNMARRIED WOMEN
98.5/ 100
METRIC RATING
72nd/ 347
METRIC RANK
35.4%
BIRTHS TO UNMARRIED WOMEN
0.7/ 100
METRIC RATING
247th/ 347
METRIC RANK
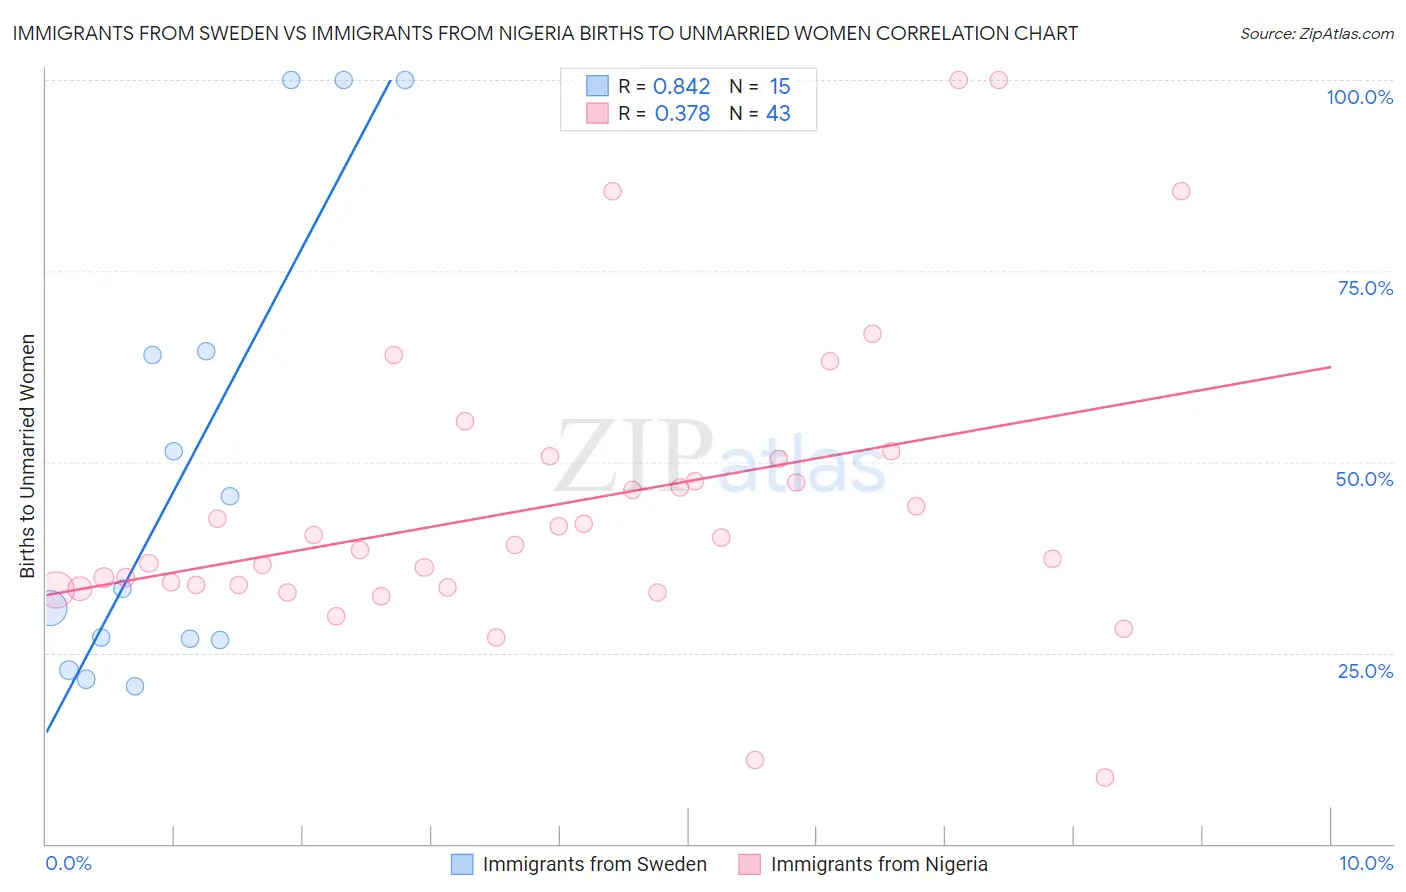
Immigrants from Sweden vs Immigrants from Nigeria Births to Unmarried Women Correlation Chart
The statistical analysis conducted on geographies consisting of 155,904,998 people shows a very strong positive correlation between the proportion of Immigrants from Sweden and percentage of births to unmarried women in the United States with a correlation coefficient (R) of 0.842 and weighted average of 28.5%. Similarly, the statistical analysis conducted on geographies consisting of 272,772,821 people shows a mild positive correlation between the proportion of Immigrants from Nigeria and percentage of births to unmarried women in the United States with a correlation coefficient (R) of 0.378 and weighted average of 35.4%, a difference of 24.1%.
Births to Unmarried Women Correlation Summary
| Measurement | Immigrants from Sweden | Immigrants from Nigeria |
| Minimum | 20.6% | 8.7% |
| Maximum | 100.0% | 100.0% |
| Range | 79.4% | 91.3% |
| Mean | 49.0% | 44.4% |
| Median | 33.4% | 39.0% |
| Interquartile 25% (IQ1) | 26.6% | 33.6% |
| Interquartile 75% (IQ3) | 64.5% | 50.4% |
| Interquartile Range (IQR) | 37.9% | 16.8% |
| Standard Deviation (Sample) | 30.0% | 19.4% |
| Standard Deviation (Population) | 29.0% | 19.2% |
Similar Demographics by Births to Unmarried Women
Demographics Similar to Immigrants from Sweden by Births to Unmarried Women
In terms of births to unmarried women, the demographic groups most similar to Immigrants from Sweden are Albanian (28.5%, a difference of 0.050%), Jordanian (28.5%, a difference of 0.060%), Immigrants from Bolivia (28.6%, a difference of 0.070%), Immigrants from Switzerland (28.6%, a difference of 0.16%), and Israeli (28.6%, a difference of 0.18%).
| Demographics | Rating | Rank | Births to Unmarried Women |
| Immigrants | Czechoslovakia | 98.8 /100 | #65 | Exceptional 28.4% |
| Immigrants | Egypt | 98.8 /100 | #66 | Exceptional 28.4% |
| Palestinians | 98.7 /100 | #67 | Exceptional 28.4% |
| Immigrants | Europe | 98.7 /100 | #68 | Exceptional 28.4% |
| Bolivians | 98.7 /100 | #69 | Exceptional 28.5% |
| Laotians | 98.6 /100 | #70 | Exceptional 28.5% |
| Jordanians | 98.5 /100 | #71 | Exceptional 28.5% |
| Immigrants | Sweden | 98.5 /100 | #72 | Exceptional 28.5% |
| Albanians | 98.5 /100 | #73 | Exceptional 28.5% |
| Immigrants | Bolivia | 98.5 /100 | #74 | Exceptional 28.6% |
| Immigrants | Switzerland | 98.4 /100 | #75 | Exceptional 28.6% |
| Israelis | 98.4 /100 | #76 | Exceptional 28.6% |
| Immigrants | Northern Europe | 98.3 /100 | #77 | Exceptional 28.6% |
| Zimbabweans | 98.2 /100 | #78 | Exceptional 28.7% |
| Danes | 98.2 /100 | #79 | Exceptional 28.7% |
Demographics Similar to Immigrants from Nigeria by Births to Unmarried Women
In terms of births to unmarried women, the demographic groups most similar to Immigrants from Nigeria are Nigerian (35.3%, a difference of 0.21%), Shoshone (35.3%, a difference of 0.32%), Nonimmigrants (35.5%, a difference of 0.33%), Bermudan (35.5%, a difference of 0.34%), and Guyanese (35.2%, a difference of 0.66%).
| Demographics | Rating | Rank | Births to Unmarried Women |
| Immigrants | Middle Africa | 1.2 /100 | #240 | Tragic 34.9% |
| Immigrants | Guyana | 1.2 /100 | #241 | Tragic 35.0% |
| Indonesians | 1.2 /100 | #242 | Tragic 35.0% |
| Japanese | 0.9 /100 | #243 | Tragic 35.2% |
| Guyanese | 0.9 /100 | #244 | Tragic 35.2% |
| Shoshone | 0.8 /100 | #245 | Tragic 35.3% |
| Nigerians | 0.7 /100 | #246 | Tragic 35.3% |
| Immigrants | Nigeria | 0.7 /100 | #247 | Tragic 35.4% |
| Immigrants | Nonimmigrants | 0.6 /100 | #248 | Tragic 35.5% |
| Bermudans | 0.6 /100 | #249 | Tragic 35.5% |
| Mexican American Indians | 0.4 /100 | #250 | Tragic 35.7% |
| Immigrants | Western Africa | 0.3 /100 | #251 | Tragic 36.0% |
| Salvadorans | 0.3 /100 | #252 | Tragic 36.0% |
| Immigrants | Portugal | 0.2 /100 | #253 | Tragic 36.2% |
| Potawatomi | 0.2 /100 | #254 | Tragic 36.2% |