Immigrants from Sweden vs Luxembourger Births to Unmarried Women
COMPARE
Immigrants from Sweden
Luxembourger
Births to Unmarried Women
Births to Unmarried Women Comparison
Immigrants from Sweden
Luxembourgers
28.5%
BIRTHS TO UNMARRIED WOMEN
98.5/ 100
METRIC RATING
72nd/ 347
METRIC RANK
29.4%
BIRTHS TO UNMARRIED WOMEN
95.2/ 100
METRIC RATING
100th/ 347
METRIC RANK
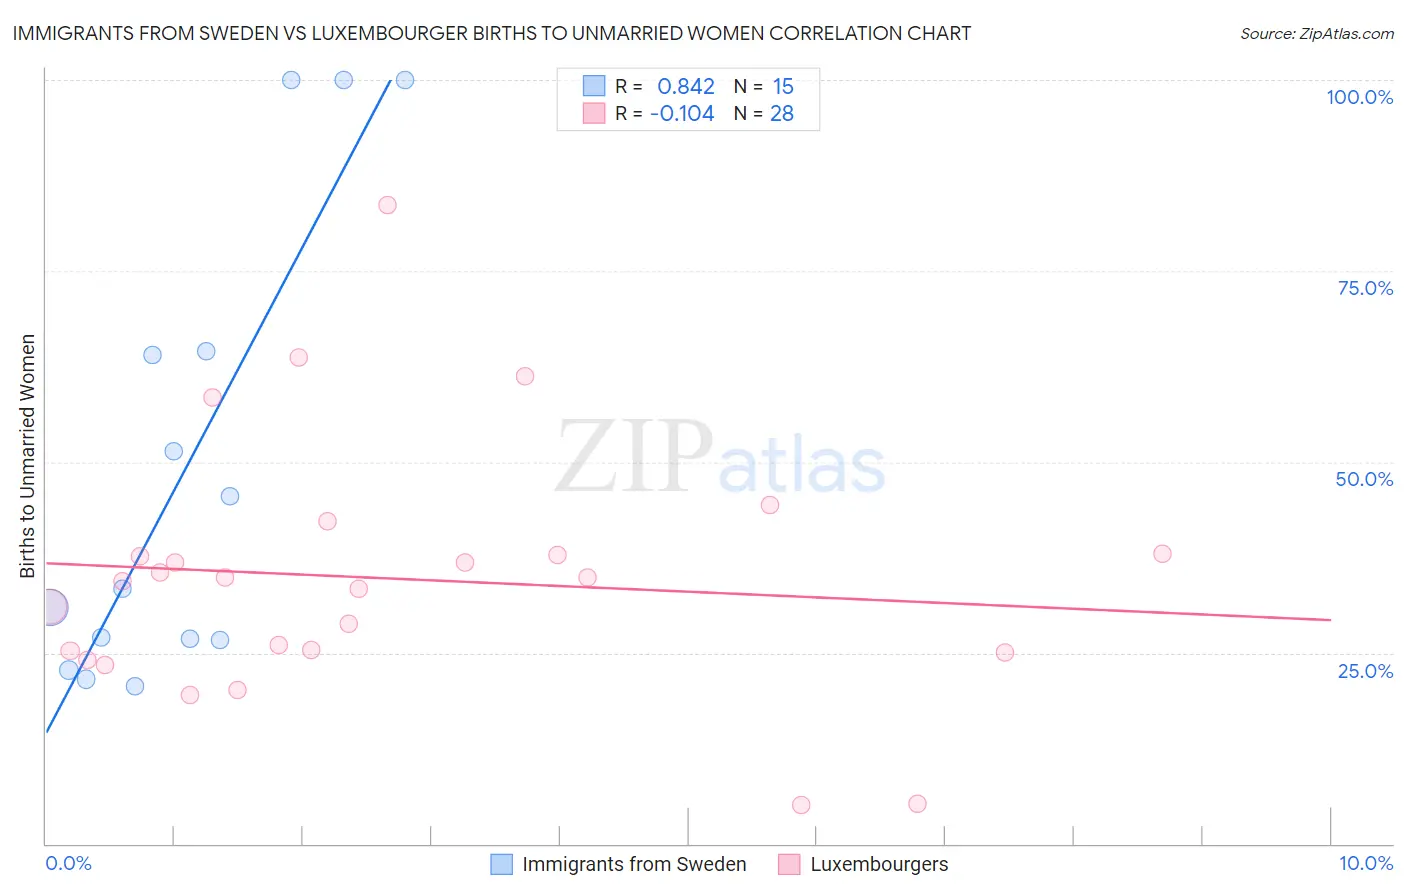
Immigrants from Sweden vs Luxembourger Births to Unmarried Women Correlation Chart
The statistical analysis conducted on geographies consisting of 155,904,998 people shows a very strong positive correlation between the proportion of Immigrants from Sweden and percentage of births to unmarried women in the United States with a correlation coefficient (R) of 0.842 and weighted average of 28.5%. Similarly, the statistical analysis conducted on geographies consisting of 138,038,346 people shows a poor negative correlation between the proportion of Luxembourgers and percentage of births to unmarried women in the United States with a correlation coefficient (R) of -0.104 and weighted average of 29.4%, a difference of 3.1%.
Births to Unmarried Women Correlation Summary
| Measurement | Immigrants from Sweden | Luxembourger |
| Minimum | 20.6% | 5.1% |
| Maximum | 100.0% | 83.6% |
| Range | 79.4% | 78.5% |
| Mean | 49.0% | 34.7% |
| Median | 33.4% | 34.6% |
| Interquartile 25% (IQ1) | 26.6% | 25.1% |
| Interquartile 75% (IQ3) | 64.5% | 37.9% |
| Interquartile Range (IQR) | 37.9% | 12.7% |
| Standard Deviation (Sample) | 30.0% | 16.7% |
| Standard Deviation (Population) | 29.0% | 16.4% |
Similar Demographics by Births to Unmarried Women
Demographics Similar to Immigrants from Sweden by Births to Unmarried Women
In terms of births to unmarried women, the demographic groups most similar to Immigrants from Sweden are Albanian (28.5%, a difference of 0.050%), Jordanian (28.5%, a difference of 0.060%), Immigrants from Bolivia (28.6%, a difference of 0.070%), Immigrants from Switzerland (28.6%, a difference of 0.16%), and Israeli (28.6%, a difference of 0.18%).
| Demographics | Rating | Rank | Births to Unmarried Women |
| Immigrants | Czechoslovakia | 98.8 /100 | #65 | Exceptional 28.4% |
| Immigrants | Egypt | 98.8 /100 | #66 | Exceptional 28.4% |
| Palestinians | 98.7 /100 | #67 | Exceptional 28.4% |
| Immigrants | Europe | 98.7 /100 | #68 | Exceptional 28.4% |
| Bolivians | 98.7 /100 | #69 | Exceptional 28.5% |
| Laotians | 98.6 /100 | #70 | Exceptional 28.5% |
| Jordanians | 98.5 /100 | #71 | Exceptional 28.5% |
| Immigrants | Sweden | 98.5 /100 | #72 | Exceptional 28.5% |
| Albanians | 98.5 /100 | #73 | Exceptional 28.5% |
| Immigrants | Bolivia | 98.5 /100 | #74 | Exceptional 28.6% |
| Immigrants | Switzerland | 98.4 /100 | #75 | Exceptional 28.6% |
| Israelis | 98.4 /100 | #76 | Exceptional 28.6% |
| Immigrants | Northern Europe | 98.3 /100 | #77 | Exceptional 28.6% |
| Zimbabweans | 98.2 /100 | #78 | Exceptional 28.7% |
| Danes | 98.2 /100 | #79 | Exceptional 28.7% |
Demographics Similar to Luxembourgers by Births to Unmarried Women
In terms of births to unmarried women, the demographic groups most similar to Luxembourgers are Immigrants from Denmark (29.4%, a difference of 0.0%), Immigrants from Syria (29.4%, a difference of 0.24%), Immigrants from South Africa (29.3%, a difference of 0.26%), Immigrants from Northern Africa (29.5%, a difference of 0.29%), and Norwegian (29.3%, a difference of 0.30%).
| Demographics | Rating | Rank | Births to Unmarried Women |
| Estonians | 96.5 /100 | #93 | Exceptional 29.2% |
| Ukrainians | 96.3 /100 | #94 | Exceptional 29.2% |
| Immigrants | Vietnam | 96.1 /100 | #95 | Exceptional 29.3% |
| Norwegians | 95.8 /100 | #96 | Exceptional 29.3% |
| Immigrants | South Africa | 95.7 /100 | #97 | Exceptional 29.3% |
| Immigrants | Syria | 95.7 /100 | #98 | Exceptional 29.4% |
| Immigrants | Denmark | 95.3 /100 | #99 | Exceptional 29.4% |
| Luxembourgers | 95.2 /100 | #100 | Exceptional 29.4% |
| Immigrants | Northern Africa | 94.7 /100 | #101 | Exceptional 29.5% |
| Australians | 94.6 /100 | #102 | Exceptional 29.5% |
| Lebanese | 94.4 /100 | #103 | Exceptional 29.5% |
| Lithuanians | 94.4 /100 | #104 | Exceptional 29.6% |
| Immigrants | Nepal | 94.3 /100 | #105 | Exceptional 29.6% |
| Swedes | 93.8 /100 | #106 | Exceptional 29.6% |
| Immigrants | Brazil | 93.7 /100 | #107 | Exceptional 29.6% |