Asian vs Ugandan Average Family Size
COMPARE
Asian
Ugandan
Average Family Size
Average Family Size Comparison
Asians
Ugandans
3.28
AVERAGE FAMILY SIZE
97.0/ 100
METRIC RATING
108th/ 347
METRIC RANK
3.23
AVERAGE FAMILY SIZE
58.4/ 100
METRIC RATING
165th/ 347
METRIC RANK
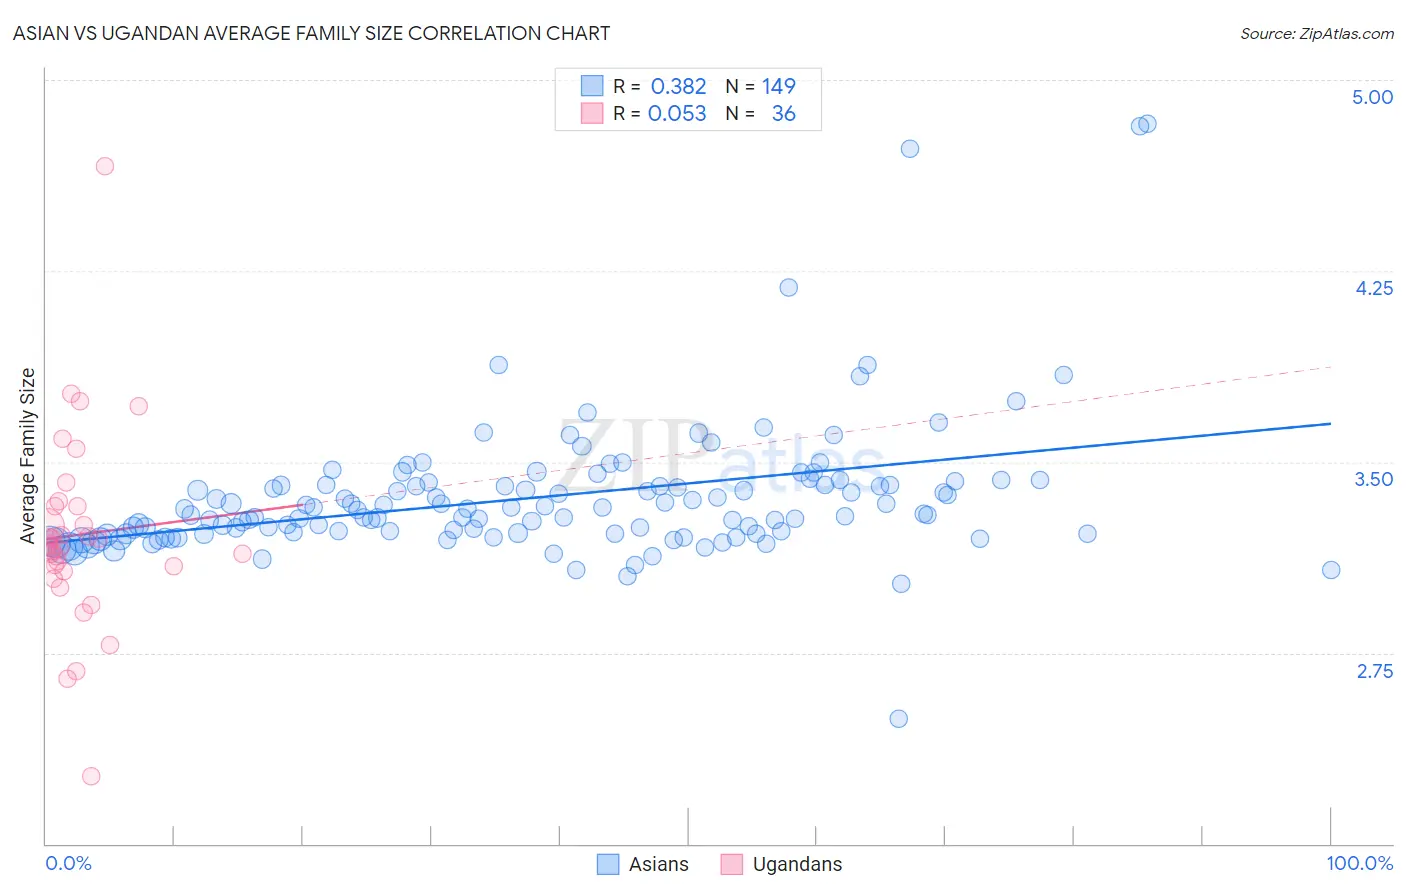
Asian vs Ugandan Average Family Size Correlation Chart
The statistical analysis conducted on geographies consisting of 550,276,213 people shows a mild positive correlation between the proportion of Asians and average family size in the United States with a correlation coefficient (R) of 0.382 and weighted average of 3.28. Similarly, the statistical analysis conducted on geographies consisting of 93,998,632 people shows a slight positive correlation between the proportion of Ugandans and average family size in the United States with a correlation coefficient (R) of 0.053 and weighted average of 3.23, a difference of 1.4%.
Average Family Size Correlation Summary
| Measurement | Asian | Ugandan |
| Minimum | 2.49 | 2.26 |
| Maximum | 4.83 | 4.66 |
| Range | 2.34 | 2.40 |
| Mean | 3.36 | 3.21 |
| Median | 3.29 | 3.17 |
| Interquartile 25% (IQ1) | 3.22 | 3.08 |
| Interquartile 75% (IQ3) | 3.41 | 3.33 |
| Interquartile Range (IQR) | 0.19 | 0.25 |
| Standard Deviation (Sample) | 0.28 | 0.39 |
| Standard Deviation (Population) | 0.28 | 0.38 |
Similar Demographics by Average Family Size
Demographics Similar to Asians by Average Family Size
In terms of average family size, the demographic groups most similar to Asians are Puerto Rican (3.28, a difference of 0.050%), Bahamian (3.28, a difference of 0.060%), Indonesian (3.28, a difference of 0.11%), Ghanaian (3.29, a difference of 0.17%), and Black/African American (3.27, a difference of 0.17%).
| Demographics | Rating | Rank | Average Family Size |
| Immigrants | Burma/Myanmar | 98.6 /100 | #101 | Exceptional 3.29 |
| West Indians | 98.5 /100 | #102 | Exceptional 3.29 |
| Immigrants | Western Africa | 98.4 /100 | #103 | Exceptional 3.29 |
| Bolivians | 98.3 /100 | #104 | Exceptional 3.29 |
| Immigrants | Ghana | 98.1 /100 | #105 | Exceptional 3.29 |
| Paiute | 98.0 /100 | #106 | Exceptional 3.29 |
| Ghanaians | 98.0 /100 | #107 | Exceptional 3.29 |
| Asians | 97.0 /100 | #108 | Exceptional 3.28 |
| Puerto Ricans | 96.7 /100 | #109 | Exceptional 3.28 |
| Bahamians | 96.6 /100 | #110 | Exceptional 3.28 |
| Indonesians | 96.2 /100 | #111 | Exceptional 3.28 |
| Blacks/African Americans | 95.7 /100 | #112 | Exceptional 3.27 |
| Immigrants | Panama | 95.6 /100 | #113 | Exceptional 3.27 |
| South Americans | 95.1 /100 | #114 | Exceptional 3.27 |
| Immigrants | Liberia | 95.0 /100 | #115 | Exceptional 3.27 |
Demographics Similar to Ugandans by Average Family Size
In terms of average family size, the demographic groups most similar to Ugandans are Egyptian (3.23, a difference of 0.0%), Uruguayan (3.23, a difference of 0.010%), Immigrants from Senegal (3.23, a difference of 0.020%), Immigrants from Uganda (3.23, a difference of 0.030%), and Dutch West Indian (3.23, a difference of 0.030%).
| Demographics | Rating | Rank | Average Family Size |
| Iraqis | 64.3 /100 | #158 | Good 3.24 |
| Ethiopians | 63.9 /100 | #159 | Good 3.24 |
| Immigrants | Iraq | 63.7 /100 | #160 | Good 3.24 |
| Immigrants | Chile | 63.2 /100 | #161 | Good 3.24 |
| Immigrants | Uganda | 60.1 /100 | #162 | Good 3.23 |
| Uruguayans | 58.8 /100 | #163 | Average 3.23 |
| Egyptians | 58.6 /100 | #164 | Average 3.23 |
| Ugandans | 58.4 /100 | #165 | Average 3.23 |
| Immigrants | Senegal | 57.5 /100 | #166 | Average 3.23 |
| Dutch West Indians | 56.9 /100 | #167 | Average 3.23 |
| Taiwanese | 54.2 /100 | #168 | Average 3.23 |
| Aleuts | 54.1 /100 | #169 | Average 3.23 |
| Arabs | 53.8 /100 | #170 | Average 3.23 |
| Chileans | 53.2 /100 | #171 | Average 3.23 |
| Immigrants | Congo | 52.7 /100 | #172 | Average 3.23 |