Immigrants from St. Vincent and the Grenadines vs Immigrants from Haiti Single Mother Households
COMPARE
Immigrants from St. Vincent and the Grenadines
Immigrants from Haiti
Single Mother Households
Single Mother Households Comparison
Immigrants from St. Vincent and the Grenadines
Immigrants from Haiti
8.0%
SINGLE MOTHER HOUSEHOLDS
0.0/ 100
METRIC RATING
307th/ 347
METRIC RANK
8.4%
SINGLE MOTHER HOUSEHOLDS
0.0/ 100
METRIC RATING
327th/ 347
METRIC RANK
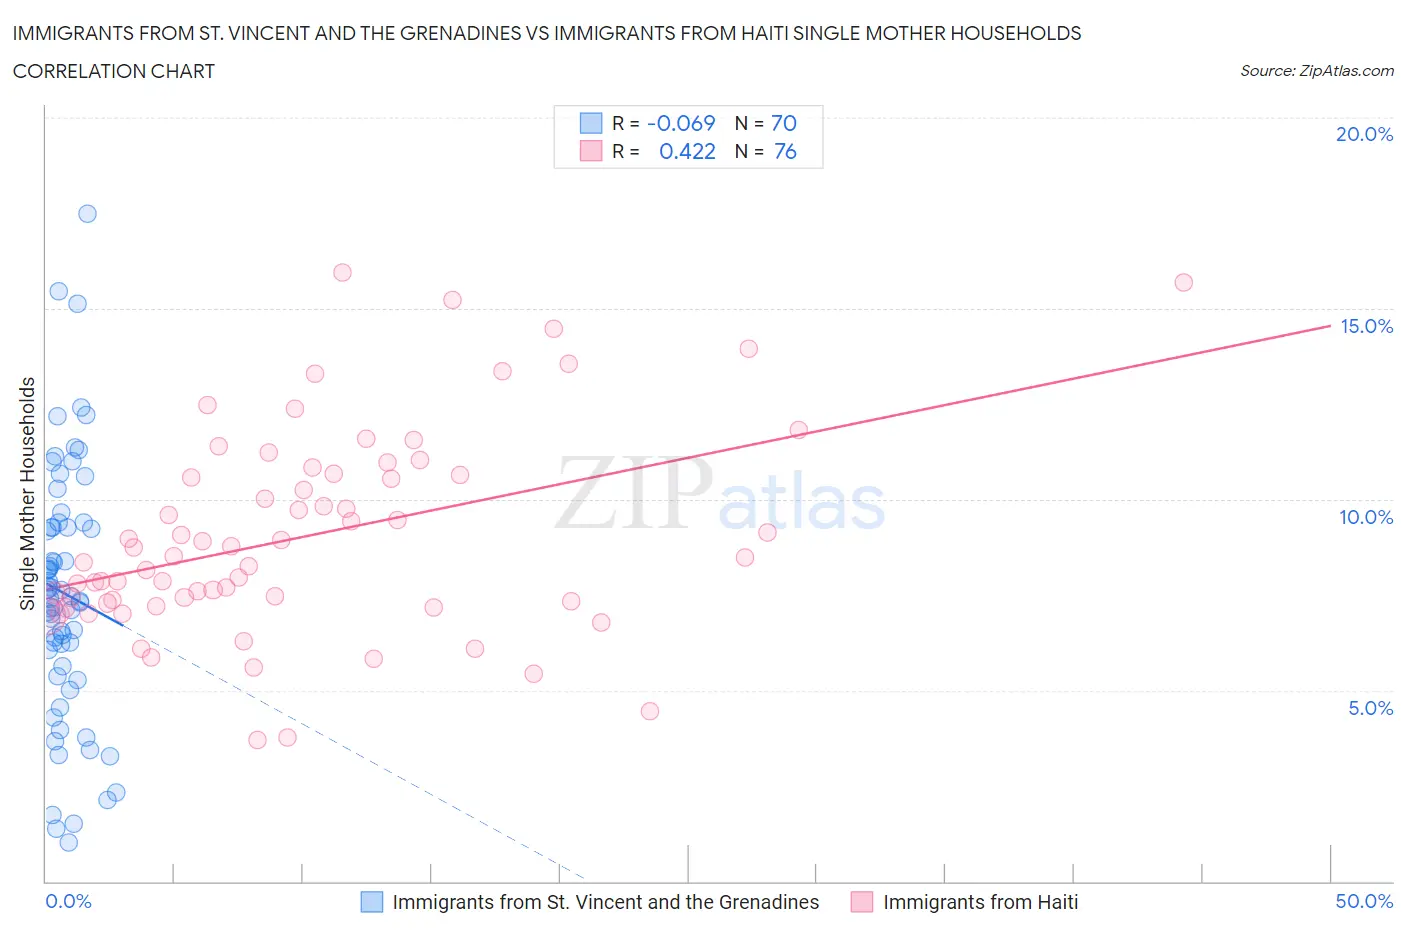
Immigrants from St. Vincent and the Grenadines vs Immigrants from Haiti Single Mother Households Correlation Chart
The statistical analysis conducted on geographies consisting of 56,167,632 people shows a slight negative correlation between the proportion of Immigrants from St. Vincent and the Grenadines and percentage of single mother households in the United States with a correlation coefficient (R) of -0.069 and weighted average of 8.0%. Similarly, the statistical analysis conducted on geographies consisting of 224,778,467 people shows a moderate positive correlation between the proportion of Immigrants from Haiti and percentage of single mother households in the United States with a correlation coefficient (R) of 0.422 and weighted average of 8.4%, a difference of 4.3%.
Single Mother Households Correlation Summary
| Measurement | Immigrants from St. Vincent and the Grenadines | Immigrants from Haiti |
| Minimum | 1.0% | 3.7% |
| Maximum | 17.5% | 15.9% |
| Range | 16.5% | 12.2% |
| Mean | 7.5% | 9.0% |
| Median | 7.4% | 8.5% |
| Interquartile 25% (IQ1) | 5.6% | 7.3% |
| Interquartile 75% (IQ3) | 9.3% | 10.6% |
| Interquartile Range (IQR) | 3.6% | 3.3% |
| Standard Deviation (Sample) | 3.3% | 2.7% |
| Standard Deviation (Population) | 3.3% | 2.7% |
Demographics Similar to Immigrants from St. Vincent and the Grenadines and Immigrants from Haiti by Single Mother Households
In terms of single mother households, the demographic groups most similar to Immigrants from St. Vincent and the Grenadines are Immigrants from Central America (8.1%, a difference of 0.020%), Cheyenne (8.1%, a difference of 0.46%), Honduran (8.1%, a difference of 0.51%), Immigrants from Congo (8.1%, a difference of 0.81%), and Bangladeshi (8.1%, a difference of 1.1%). Similarly, the demographic groups most similar to Immigrants from Haiti are British West Indian (8.4%, a difference of 0.15%), Immigrants from Caribbean (8.4%, a difference of 0.27%), Immigrants from Jamaica (8.4%, a difference of 0.46%), Haitian (8.3%, a difference of 0.89%), and Pima (8.3%, a difference of 1.4%).
| Demographics | Rating | Rank | Single Mother Households |
| Immigrants | St. Vincent and the Grenadines | 0.0 /100 | #307 | Tragic 8.0% |
| Immigrants | Central America | 0.0 /100 | #308 | Tragic 8.1% |
| Cheyenne | 0.0 /100 | #309 | Tragic 8.1% |
| Hondurans | 0.0 /100 | #310 | Tragic 8.1% |
| Immigrants | Congo | 0.0 /100 | #311 | Tragic 8.1% |
| Bangladeshis | 0.0 /100 | #312 | Tragic 8.1% |
| Immigrants | Grenada | 0.0 /100 | #313 | Tragic 8.2% |
| Immigrants | Mexico | 0.0 /100 | #314 | Tragic 8.2% |
| Immigrants | Western Africa | 0.0 /100 | #315 | Tragic 8.2% |
| Africans | 0.0 /100 | #316 | Tragic 8.2% |
| Immigrants | Honduras | 0.0 /100 | #317 | Tragic 8.2% |
| Senegalese | 0.0 /100 | #318 | Tragic 8.2% |
| Jamaicans | 0.0 /100 | #319 | Tragic 8.2% |
| Bahamians | 0.0 /100 | #320 | Tragic 8.3% |
| Immigrants | Senegal | 0.0 /100 | #321 | Tragic 8.3% |
| Pima | 0.0 /100 | #322 | Tragic 8.3% |
| Haitians | 0.0 /100 | #323 | Tragic 8.3% |
| Immigrants | Jamaica | 0.0 /100 | #324 | Tragic 8.4% |
| Immigrants | Caribbean | 0.0 /100 | #325 | Tragic 8.4% |
| British West Indians | 0.0 /100 | #326 | Tragic 8.4% |
| Immigrants | Haiti | 0.0 /100 | #327 | Tragic 8.4% |