Seminole vs Soviet Union Single Father Households
COMPARE
Seminole
Soviet Union
Single Father Households
Single Father Households Comparison
Seminole
Soviet Union
2.6%
SINGLE FATHER HOUSEHOLDS
0.3/ 100
METRIC RATING
270th/ 347
METRIC RANK
1.8%
SINGLE FATHER HOUSEHOLDS
100.0/ 100
METRIC RATING
1st/ 347
METRIC RANK
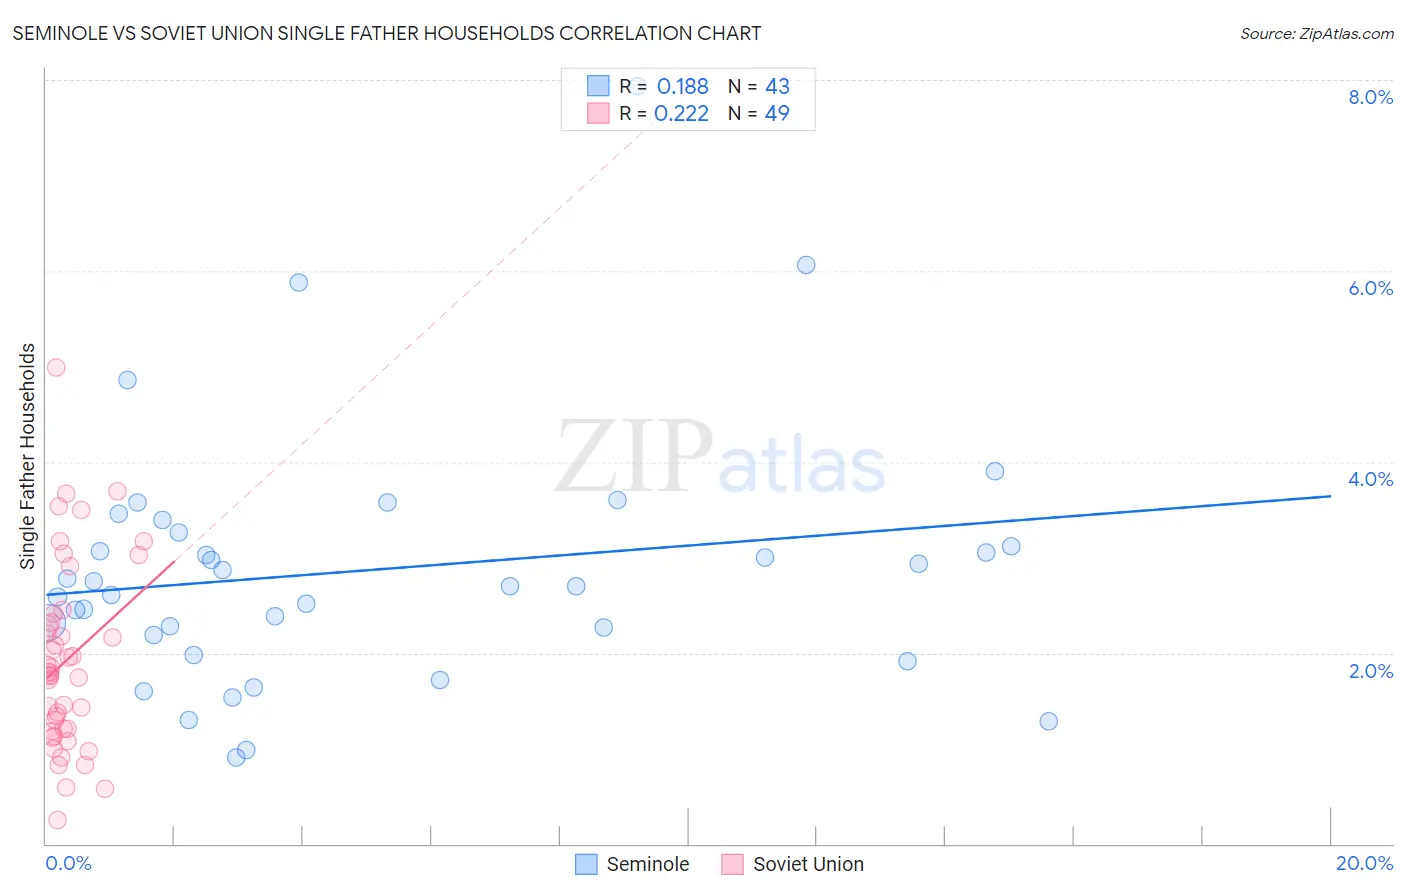
Seminole vs Soviet Union Single Father Households Correlation Chart
The statistical analysis conducted on geographies consisting of 118,036,059 people shows a poor positive correlation between the proportion of Seminole and percentage of single father households in the United States with a correlation coefficient (R) of 0.188 and weighted average of 2.6%. Similarly, the statistical analysis conducted on geographies consisting of 43,425,505 people shows a weak positive correlation between the proportion of Soviet Union and percentage of single father households in the United States with a correlation coefficient (R) of 0.222 and weighted average of 1.8%, a difference of 44.5%.
Single Father Households Correlation Summary
| Measurement | Seminole | Soviet Union |
| Minimum | 0.90% | 0.25% |
| Maximum | 7.9% | 5.0% |
| Range | 7.0% | 4.7% |
| Mean | 2.9% | 1.9% |
| Median | 2.7% | 1.8% |
| Interquartile 25% (IQ1) | 2.2% | 1.2% |
| Interquartile 75% (IQ3) | 3.3% | 2.4% |
| Interquartile Range (IQR) | 1.1% | 1.2% |
| Standard Deviation (Sample) | 1.3% | 0.97% |
| Standard Deviation (Population) | 1.3% | 0.96% |
Similar Demographics by Single Father Households
Demographics Similar to Seminole by Single Father Households
In terms of single father households, the demographic groups most similar to Seminole are Cuban (2.6%, a difference of 0.14%), Creek (2.6%, a difference of 0.36%), Belizean (2.6%, a difference of 0.37%), Iroquois (2.6%, a difference of 0.41%), and Puerto Rican (2.6%, a difference of 0.44%).
| Demographics | Rating | Rank | Single Father Households |
| Dominicans | 0.8 /100 | #263 | Tragic 2.5% |
| Indonesians | 0.5 /100 | #264 | Tragic 2.6% |
| Immigrants | Micronesia | 0.5 /100 | #265 | Tragic 2.6% |
| French American Indians | 0.5 /100 | #266 | Tragic 2.6% |
| Guamanians/Chamorros | 0.4 /100 | #267 | Tragic 2.6% |
| Haitians | 0.4 /100 | #268 | Tragic 2.6% |
| Cubans | 0.3 /100 | #269 | Tragic 2.6% |
| Seminole | 0.3 /100 | #270 | Tragic 2.6% |
| Creek | 0.2 /100 | #271 | Tragic 2.6% |
| Belizeans | 0.2 /100 | #272 | Tragic 2.6% |
| Iroquois | 0.2 /100 | #273 | Tragic 2.6% |
| Puerto Ricans | 0.2 /100 | #274 | Tragic 2.6% |
| Immigrants | Dominican Republic | 0.2 /100 | #275 | Tragic 2.6% |
| Immigrants | Haiti | 0.1 /100 | #276 | Tragic 2.6% |
| Shoshone | 0.1 /100 | #277 | Tragic 2.6% |
Demographics Similar to Soviet Union by Single Father Households
In terms of single father households, the demographic groups most similar to Soviet Union are Immigrants from Israel (1.8%, a difference of 0.040%), Filipino (1.8%, a difference of 0.46%), Immigrants from Uzbekistan (1.8%, a difference of 1.1%), Immigrants from Hong Kong (1.8%, a difference of 2.1%), and Immigrants from Taiwan (1.8%, a difference of 2.5%).
| Demographics | Rating | Rank | Single Father Households |
| Soviet Union | 100.0 /100 | #1 | Exceptional 1.8% |
| Immigrants | Israel | 100.0 /100 | #2 | Exceptional 1.8% |
| Filipinos | 100.0 /100 | #3 | Exceptional 1.8% |
| Immigrants | Uzbekistan | 100.0 /100 | #4 | Exceptional 1.8% |
| Immigrants | Hong Kong | 100.0 /100 | #5 | Exceptional 1.8% |
| Immigrants | Taiwan | 100.0 /100 | #6 | Exceptional 1.8% |
| Cypriots | 100.0 /100 | #7 | Exceptional 1.8% |
| Immigrants | Ireland | 100.0 /100 | #8 | Exceptional 1.8% |
| Immigrants | China | 100.0 /100 | #9 | Exceptional 1.8% |
| Okinawans | 100.0 /100 | #10 | Exceptional 1.9% |
| Immigrants | Belarus | 100.0 /100 | #11 | Exceptional 1.9% |
| Immigrants | Greece | 100.0 /100 | #12 | Exceptional 1.9% |
| Immigrants | Singapore | 100.0 /100 | #13 | Exceptional 1.9% |
| Immigrants | Lithuania | 100.0 /100 | #14 | Exceptional 1.9% |
| Immigrants | Eastern Asia | 100.0 /100 | #15 | Exceptional 1.9% |