German vs Soviet Union Single Father Households
COMPARE
German
Soviet Union
Single Father Households
Single Father Households Comparison
Germans
Soviet Union
2.4%
SINGLE FATHER HOUSEHOLDS
28.0/ 100
METRIC RATING
197th/ 347
METRIC RANK
1.8%
SINGLE FATHER HOUSEHOLDS
100.0/ 100
METRIC RATING
1st/ 347
METRIC RANK
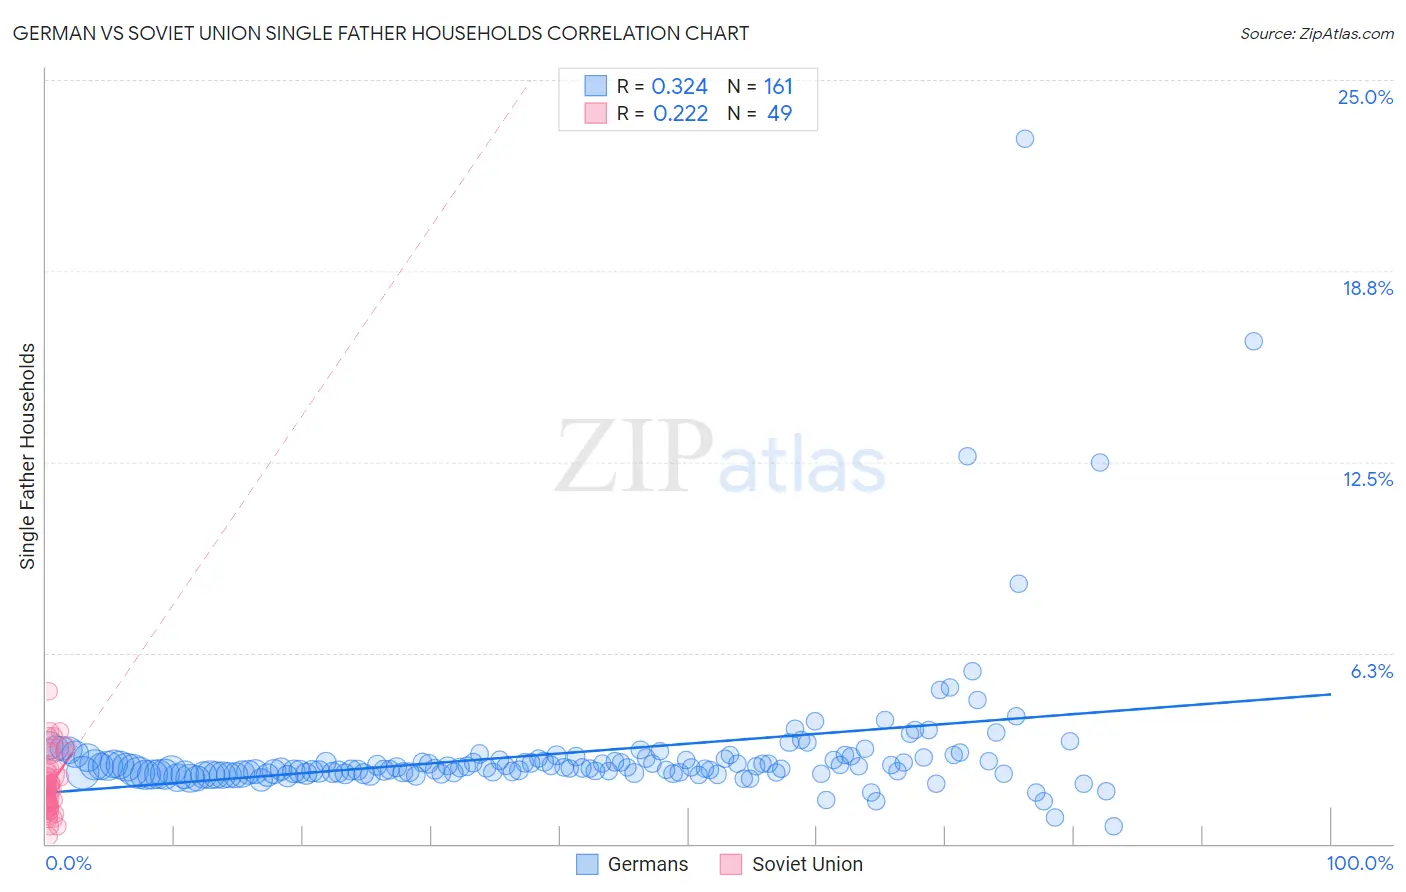
German vs Soviet Union Single Father Households Correlation Chart
The statistical analysis conducted on geographies consisting of 562,897,212 people shows a mild positive correlation between the proportion of Germans and percentage of single father households in the United States with a correlation coefficient (R) of 0.324 and weighted average of 2.4%. Similarly, the statistical analysis conducted on geographies consisting of 43,425,505 people shows a weak positive correlation between the proportion of Soviet Union and percentage of single father households in the United States with a correlation coefficient (R) of 0.222 and weighted average of 1.8%, a difference of 32.5%.
Single Father Households Correlation Summary
| Measurement | German | Soviet Union |
| Minimum | 0.56% | 0.25% |
| Maximum | 23.1% | 5.0% |
| Range | 22.5% | 4.7% |
| Mean | 3.0% | 1.9% |
| Median | 2.5% | 1.8% |
| Interquartile 25% (IQ1) | 2.3% | 1.2% |
| Interquartile 75% (IQ3) | 2.8% | 2.4% |
| Interquartile Range (IQR) | 0.50% | 1.2% |
| Standard Deviation (Sample) | 2.4% | 0.97% |
| Standard Deviation (Population) | 2.3% | 0.96% |
Similar Demographics by Single Father Households
Demographics Similar to Germans by Single Father Households
In terms of single father households, the demographic groups most similar to Germans are Kenyan (2.4%, a difference of 0.0%), Scandinavian (2.4%, a difference of 0.050%), Immigrants from Philippines (2.4%, a difference of 0.060%), Immigrants from Vietnam (2.4%, a difference of 0.080%), and Peruvian (2.4%, a difference of 0.080%).
| Demographics | Rating | Rank | Single Father Households |
| French | 31.7 /100 | #190 | Fair 2.4% |
| Immigrants | Africa | 30.0 /100 | #191 | Fair 2.4% |
| Immigrants | Sudan | 29.8 /100 | #192 | Fair 2.4% |
| Uruguayans | 29.7 /100 | #193 | Fair 2.4% |
| Panamanians | 29.6 /100 | #194 | Fair 2.4% |
| Immigrants | Philippines | 28.7 /100 | #195 | Fair 2.4% |
| Kenyans | 28.0 /100 | #196 | Fair 2.4% |
| Germans | 28.0 /100 | #197 | Fair 2.4% |
| Scandinavians | 27.4 /100 | #198 | Fair 2.4% |
| Immigrants | Vietnam | 27.1 /100 | #199 | Fair 2.4% |
| Peruvians | 27.1 /100 | #200 | Fair 2.4% |
| Immigrants | Uganda | 26.0 /100 | #201 | Fair 2.4% |
| German Russians | 25.7 /100 | #202 | Fair 2.4% |
| French Canadians | 24.7 /100 | #203 | Fair 2.4% |
| Ecuadorians | 24.5 /100 | #204 | Fair 2.4% |
Demographics Similar to Soviet Union by Single Father Households
In terms of single father households, the demographic groups most similar to Soviet Union are Immigrants from Israel (1.8%, a difference of 0.040%), Filipino (1.8%, a difference of 0.46%), Immigrants from Uzbekistan (1.8%, a difference of 1.1%), Immigrants from Hong Kong (1.8%, a difference of 2.1%), and Immigrants from Taiwan (1.8%, a difference of 2.5%).
| Demographics | Rating | Rank | Single Father Households |
| Soviet Union | 100.0 /100 | #1 | Exceptional 1.8% |
| Immigrants | Israel | 100.0 /100 | #2 | Exceptional 1.8% |
| Filipinos | 100.0 /100 | #3 | Exceptional 1.8% |
| Immigrants | Uzbekistan | 100.0 /100 | #4 | Exceptional 1.8% |
| Immigrants | Hong Kong | 100.0 /100 | #5 | Exceptional 1.8% |
| Immigrants | Taiwan | 100.0 /100 | #6 | Exceptional 1.8% |
| Cypriots | 100.0 /100 | #7 | Exceptional 1.8% |
| Immigrants | Ireland | 100.0 /100 | #8 | Exceptional 1.8% |
| Immigrants | China | 100.0 /100 | #9 | Exceptional 1.8% |
| Okinawans | 100.0 /100 | #10 | Exceptional 1.9% |
| Immigrants | Belarus | 100.0 /100 | #11 | Exceptional 1.9% |
| Immigrants | Greece | 100.0 /100 | #12 | Exceptional 1.9% |
| Immigrants | Singapore | 100.0 /100 | #13 | Exceptional 1.9% |
| Immigrants | Lithuania | 100.0 /100 | #14 | Exceptional 1.9% |
| Immigrants | Eastern Asia | 100.0 /100 | #15 | Exceptional 1.9% |