Immigrants from Singapore vs Cuban Median Male Earnings
COMPARE
Immigrants from Singapore
Cuban
Median Male Earnings
Median Male Earnings Comparison
Immigrants from Singapore
Cubans
$71,348
MEDIAN MALE EARNINGS
100.0/ 100
METRIC RATING
5th/ 347
METRIC RANK
$46,580
MEDIAN MALE EARNINGS
0.0/ 100
METRIC RATING
310th/ 347
METRIC RANK
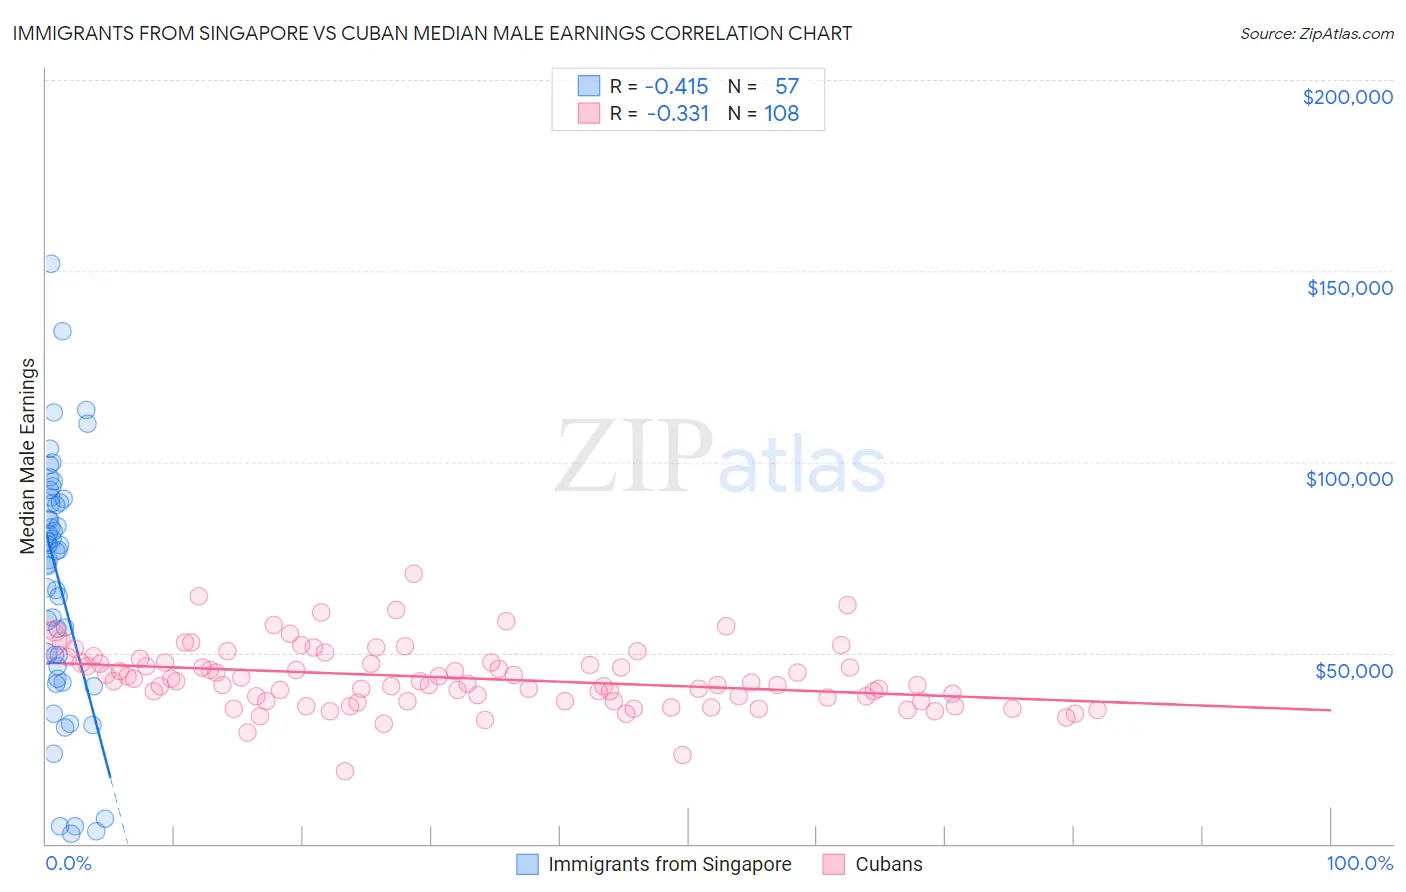
Immigrants from Singapore vs Cuban Median Male Earnings Correlation Chart
The statistical analysis conducted on geographies consisting of 137,517,070 people shows a moderate negative correlation between the proportion of Immigrants from Singapore and median male earnings in the United States with a correlation coefficient (R) of -0.415 and weighted average of $71,348. Similarly, the statistical analysis conducted on geographies consisting of 449,183,844 people shows a mild negative correlation between the proportion of Cubans and median male earnings in the United States with a correlation coefficient (R) of -0.331 and weighted average of $46,580, a difference of 53.2%.
Median Male Earnings Correlation Summary
| Measurement | Immigrants from Singapore | Cuban |
| Minimum | $2,499 | $18,938 |
| Maximum | $151,839 | $70,693 |
| Range | $149,340 | $51,755 |
| Mean | $68,476 | $43,444 |
| Median | $76,629 | $42,447 |
| Interquartile 25% (IQ1) | $44,952 | $37,372 |
| Interquartile 75% (IQ3) | $89,757 | $47,400 |
| Interquartile Range (IQR) | $44,804 | $10,028 |
| Standard Deviation (Sample) | $32,686 | $8,309 |
| Standard Deviation (Population) | $32,398 | $8,270 |
Similar Demographics by Median Male Earnings
Demographics Similar to Immigrants from Singapore by Median Male Earnings
In terms of median male earnings, the demographic groups most similar to Immigrants from Singapore are Iranian ($70,648, a difference of 0.99%), Thai ($72,135, a difference of 1.1%), Immigrants from Hong Kong ($70,146, a difference of 1.7%), Immigrants from Iran ($69,284, a difference of 3.0%), and Immigrants from South Central Asia ($68,960, a difference of 3.5%).
| Demographics | Rating | Rank | Median Male Earnings |
| Filipinos | 100.0 /100 | #1 | Exceptional $74,224 |
| Immigrants | India | 100.0 /100 | #2 | Exceptional $74,207 |
| Immigrants | Taiwan | 100.0 /100 | #3 | Exceptional $74,031 |
| Thais | 100.0 /100 | #4 | Exceptional $72,135 |
| Immigrants | Singapore | 100.0 /100 | #5 | Exceptional $71,348 |
| Iranians | 100.0 /100 | #6 | Exceptional $70,648 |
| Immigrants | Hong Kong | 100.0 /100 | #7 | Exceptional $70,146 |
| Immigrants | Iran | 100.0 /100 | #8 | Exceptional $69,284 |
| Immigrants | South Central Asia | 100.0 /100 | #9 | Exceptional $68,960 |
| Immigrants | Israel | 100.0 /100 | #10 | Exceptional $68,716 |
| Immigrants | Ireland | 100.0 /100 | #11 | Exceptional $67,698 |
| Immigrants | Australia | 100.0 /100 | #12 | Exceptional $67,634 |
| Immigrants | China | 100.0 /100 | #13 | Exceptional $67,353 |
| Okinawans | 100.0 /100 | #14 | Exceptional $67,232 |
| Immigrants | Eastern Asia | 100.0 /100 | #15 | Exceptional $66,903 |
Demographics Similar to Cubans by Median Male Earnings
In terms of median male earnings, the demographic groups most similar to Cubans are Creek ($46,594, a difference of 0.030%), Ottawa ($46,611, a difference of 0.070%), Dutch West Indian ($46,656, a difference of 0.16%), Immigrants from Dominican Republic ($46,655, a difference of 0.16%), and Apache ($46,429, a difference of 0.33%).
| Demographics | Rating | Rank | Median Male Earnings |
| Yaqui | 0.1 /100 | #303 | Tragic $46,777 |
| Bangladeshis | 0.1 /100 | #304 | Tragic $46,744 |
| Guatemalans | 0.0 /100 | #305 | Tragic $46,736 |
| Dutch West Indians | 0.0 /100 | #306 | Tragic $46,656 |
| Immigrants | Dominican Republic | 0.0 /100 | #307 | Tragic $46,655 |
| Ottawa | 0.0 /100 | #308 | Tragic $46,611 |
| Creek | 0.0 /100 | #309 | Tragic $46,594 |
| Cubans | 0.0 /100 | #310 | Tragic $46,580 |
| Apache | 0.0 /100 | #311 | Tragic $46,429 |
| Hispanics or Latinos | 0.0 /100 | #312 | Tragic $46,419 |
| Hondurans | 0.0 /100 | #313 | Tragic $46,374 |
| Chippewa | 0.0 /100 | #314 | Tragic $46,368 |
| Immigrants | Guatemala | 0.0 /100 | #315 | Tragic $46,244 |
| Immigrants | Caribbean | 0.0 /100 | #316 | Tragic $46,193 |
| Mexicans | 0.0 /100 | #317 | Tragic $46,147 |