Immigrants from Scotland vs Immigrants from Japan Average Family Size
COMPARE
Immigrants from Scotland
Immigrants from Japan
Average Family Size
Average Family Size Comparison
Immigrants from Scotland
Immigrants from Japan
3.12
AVERAGE FAMILY SIZE
0.1/ 100
METRIC RATING
315th/ 347
METRIC RANK
3.18
AVERAGE FAMILY SIZE
3.0/ 100
METRIC RATING
241st/ 347
METRIC RANK
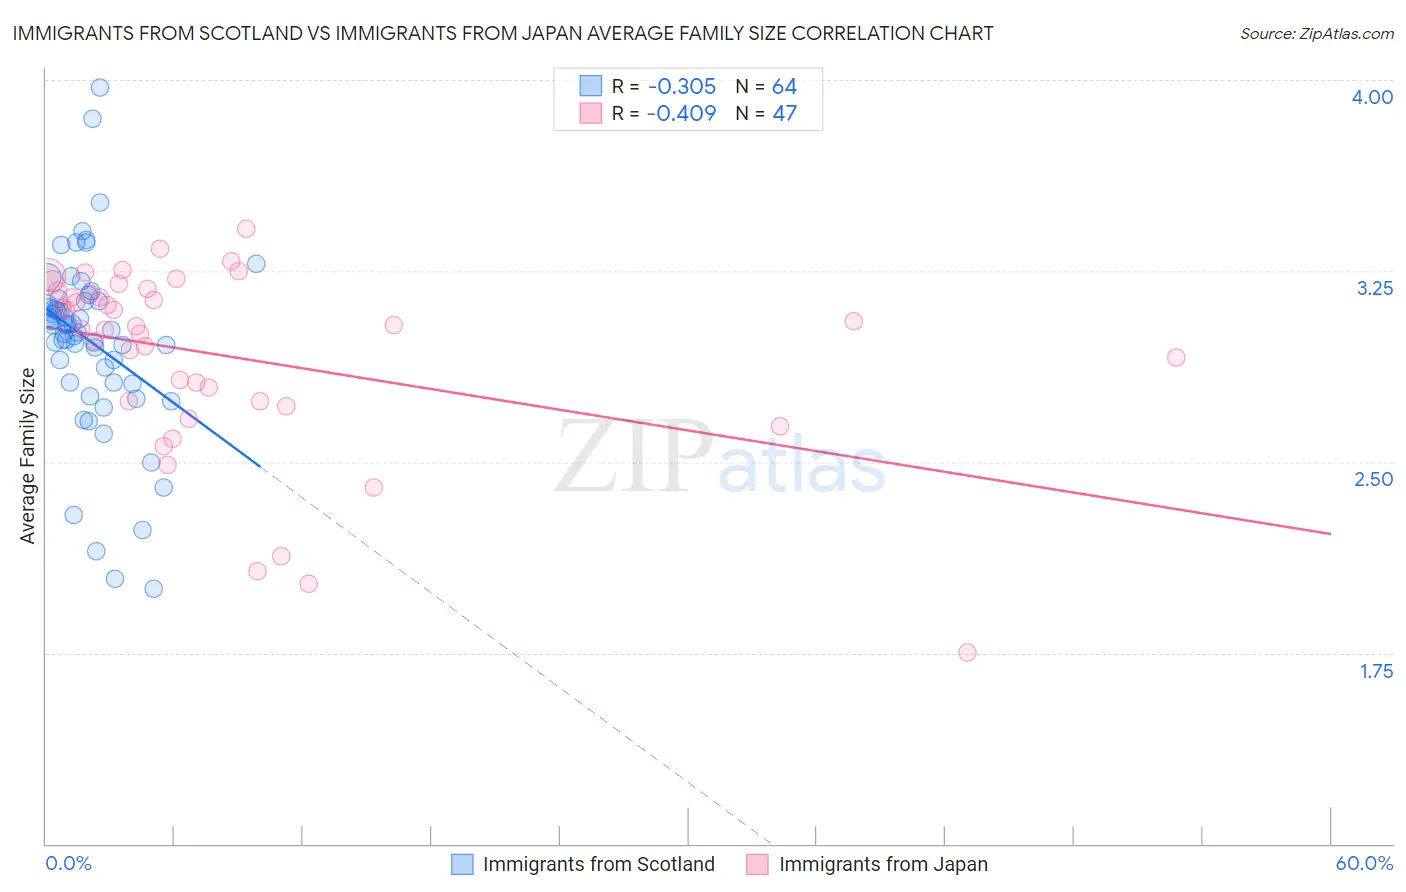
Immigrants from Scotland vs Immigrants from Japan Average Family Size Correlation Chart
The statistical analysis conducted on geographies consisting of 196,383,417 people shows a mild negative correlation between the proportion of Immigrants from Scotland and average family size in the United States with a correlation coefficient (R) of -0.305 and weighted average of 3.12. Similarly, the statistical analysis conducted on geographies consisting of 339,992,819 people shows a moderate negative correlation between the proportion of Immigrants from Japan and average family size in the United States with a correlation coefficient (R) of -0.409 and weighted average of 3.18, a difference of 1.7%.
Average Family Size Correlation Summary
| Measurement | Immigrants from Scotland | Immigrants from Japan |
| Minimum | 2.00 | 1.75 |
| Maximum | 3.97 | 3.42 |
| Range | 1.97 | 1.67 |
| Mean | 2.97 | 2.92 |
| Median | 3.03 | 3.03 |
| Interquartile 25% (IQ1) | 2.81 | 2.74 |
| Interquartile 75% (IQ3) | 3.13 | 3.17 |
| Interquartile Range (IQR) | 0.32 | 0.43 |
| Standard Deviation (Sample) | 0.36 | 0.37 |
| Standard Deviation (Population) | 0.36 | 0.37 |
Similar Demographics by Average Family Size
Demographics Similar to Immigrants from Scotland by Average Family Size
In terms of average family size, the demographic groups most similar to Immigrants from Scotland are Russian (3.12, a difference of 0.020%), Immigrants from Australia (3.13, a difference of 0.060%), Bulgarian (3.13, a difference of 0.060%), Immigrants from Northern Europe (3.13, a difference of 0.090%), and Serbian (3.12, a difference of 0.090%).
| Demographics | Rating | Rank | Average Family Size |
| Slavs | 0.1 /100 | #308 | Tragic 3.13 |
| Northern Europeans | 0.1 /100 | #309 | Tragic 3.13 |
| Czechoslovakians | 0.1 /100 | #310 | Tragic 3.13 |
| Immigrants | Northern Europe | 0.1 /100 | #311 | Tragic 3.13 |
| Immigrants | Australia | 0.1 /100 | #312 | Tragic 3.13 |
| Bulgarians | 0.1 /100 | #313 | Tragic 3.13 |
| Russians | 0.1 /100 | #314 | Tragic 3.12 |
| Immigrants | Scotland | 0.1 /100 | #315 | Tragic 3.12 |
| Serbians | 0.1 /100 | #316 | Tragic 3.12 |
| Italians | 0.1 /100 | #317 | Tragic 3.12 |
| Eastern Europeans | 0.1 /100 | #318 | Tragic 3.12 |
| Welsh | 0.1 /100 | #319 | Tragic 3.12 |
| Immigrants | North America | 0.0 /100 | #320 | Tragic 3.12 |
| Immigrants | Austria | 0.0 /100 | #321 | Tragic 3.12 |
| Immigrants | Canada | 0.0 /100 | #322 | Tragic 3.12 |
Demographics Similar to Immigrants from Japan by Average Family Size
In terms of average family size, the demographic groups most similar to Immigrants from Japan are Osage (3.18, a difference of 0.020%), Hungarian (3.18, a difference of 0.020%), Immigrants from Moldova (3.18, a difference of 0.020%), Immigrants from Southern Europe (3.18, a difference of 0.030%), and Houma (3.18, a difference of 0.050%).
| Demographics | Rating | Rank | Average Family Size |
| Iranians | 4.5 /100 | #234 | Tragic 3.18 |
| Immigrants | Turkey | 4.2 /100 | #235 | Tragic 3.18 |
| Immigrants | Portugal | 4.2 /100 | #236 | Tragic 3.18 |
| Immigrants | Romania | 3.7 /100 | #237 | Tragic 3.18 |
| Romanians | 3.7 /100 | #238 | Tragic 3.18 |
| Houma | 3.4 /100 | #239 | Tragic 3.18 |
| Osage | 3.2 /100 | #240 | Tragic 3.18 |
| Immigrants | Japan | 3.0 /100 | #241 | Tragic 3.18 |
| Hungarians | 3.0 /100 | #242 | Tragic 3.18 |
| Immigrants | Moldova | 2.9 /100 | #243 | Tragic 3.18 |
| Immigrants | Southern Europe | 2.9 /100 | #244 | Tragic 3.18 |
| Immigrants | Brazil | 2.7 /100 | #245 | Tragic 3.18 |
| Danes | 2.5 /100 | #246 | Tragic 3.17 |
| Cajuns | 2.4 /100 | #247 | Tragic 3.17 |
| Immigrants | Belarus | 2.3 /100 | #248 | Tragic 3.17 |