Immigrants from Scotland vs Estonian Divorced or Separated
COMPARE
Immigrants from Scotland
Estonian
Divorced or Separated
Divorced or Separated Comparison
Immigrants from Scotland
Estonians
12.0%
DIVORCED OR SEPARATED
65.8/ 100
METRIC RATING
160th/ 347
METRIC RANK
11.7%
DIVORCED OR SEPARATED
96.6/ 100
METRIC RATING
113th/ 347
METRIC RANK
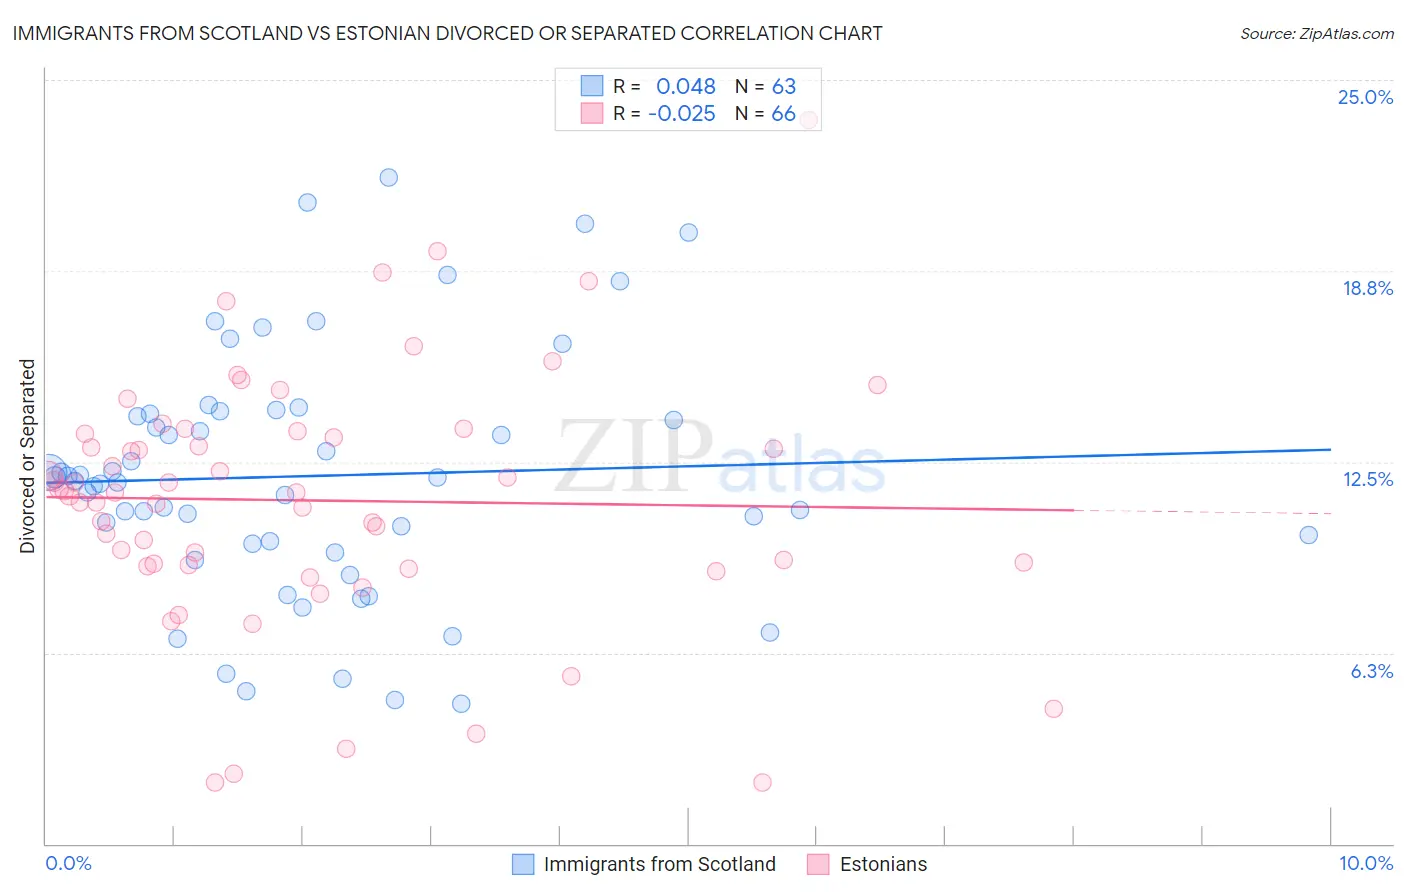
Immigrants from Scotland vs Estonian Divorced or Separated Correlation Chart
The statistical analysis conducted on geographies consisting of 196,385,271 people shows no correlation between the proportion of Immigrants from Scotland and percentage of population currently divorced or separated in the United States with a correlation coefficient (R) of 0.048 and weighted average of 12.0%. Similarly, the statistical analysis conducted on geographies consisting of 123,504,002 people shows no correlation between the proportion of Estonians and percentage of population currently divorced or separated in the United States with a correlation coefficient (R) of -0.025 and weighted average of 11.7%, a difference of 2.4%.
Divorced or Separated Correlation Summary
| Measurement | Immigrants from Scotland | Estonian |
| Minimum | 4.6% | 2.0% |
| Maximum | 21.8% | 23.7% |
| Range | 17.2% | 21.7% |
| Mean | 12.0% | 11.2% |
| Median | 11.9% | 11.5% |
| Interquartile 25% (IQ1) | 9.8% | 9.1% |
| Interquartile 75% (IQ3) | 14.1% | 13.4% |
| Interquartile Range (IQR) | 4.2% | 4.3% |
| Standard Deviation (Sample) | 4.0% | 4.1% |
| Standard Deviation (Population) | 4.0% | 4.1% |
Similar Demographics by Divorced or Separated
Demographics Similar to Immigrants from Scotland by Divorced or Separated
In terms of divorced or separated, the demographic groups most similar to Immigrants from Scotland are Icelander (12.0%, a difference of 0.010%), Immigrants from Barbados (12.0%, a difference of 0.010%), Marshallese (12.0%, a difference of 0.040%), Samoan (12.0%, a difference of 0.060%), and Navajo (12.0%, a difference of 0.070%).
| Demographics | Rating | Rank | Divorced or Separated |
| Austrians | 72.2 /100 | #153 | Good 12.0% |
| Chileans | 71.3 /100 | #154 | Good 12.0% |
| Japanese | 70.9 /100 | #155 | Good 12.0% |
| Hungarians | 70.3 /100 | #156 | Good 12.0% |
| Immigrants | Brazil | 68.8 /100 | #157 | Good 12.0% |
| Icelanders | 66.0 /100 | #158 | Good 12.0% |
| Immigrants | Barbados | 66.0 /100 | #159 | Good 12.0% |
| Immigrants | Scotland | 65.8 /100 | #160 | Good 12.0% |
| Marshallese | 64.6 /100 | #161 | Good 12.0% |
| Samoans | 64.3 /100 | #162 | Good 12.0% |
| Navajo | 63.9 /100 | #163 | Good 12.0% |
| Swiss | 63.6 /100 | #164 | Good 12.0% |
| German Russians | 61.8 /100 | #165 | Good 12.0% |
| Tohono O'odham | 60.4 /100 | #166 | Good 12.0% |
| Ethiopians | 58.5 /100 | #167 | Average 12.0% |
Demographics Similar to Estonians by Divorced or Separated
In terms of divorced or separated, the demographic groups most similar to Estonians are Immigrants from France (11.7%, a difference of 0.0%), Immigrants from Spain (11.7%, a difference of 0.050%), Immigrants from South Africa (11.7%, a difference of 0.090%), Immigrants from Czechoslovakia (11.7%, a difference of 0.090%), and Greek (11.7%, a difference of 0.10%).
| Demographics | Rating | Rank | Divorced or Separated |
| Immigrants | Kazakhstan | 97.8 /100 | #106 | Exceptional 11.7% |
| Native Hawaiians | 97.2 /100 | #107 | Exceptional 11.7% |
| Greeks | 96.9 /100 | #108 | Exceptional 11.7% |
| Immigrants | South Africa | 96.9 /100 | #109 | Exceptional 11.7% |
| Immigrants | Czechoslovakia | 96.9 /100 | #110 | Exceptional 11.7% |
| Immigrants | Spain | 96.8 /100 | #111 | Exceptional 11.7% |
| Immigrants | France | 96.6 /100 | #112 | Exceptional 11.7% |
| Estonians | 96.6 /100 | #113 | Exceptional 11.7% |
| Immigrants | Norway | 95.9 /100 | #114 | Exceptional 11.7% |
| Lithuanians | 95.7 /100 | #115 | Exceptional 11.7% |
| Immigrants | Iraq | 95.4 /100 | #116 | Exceptional 11.7% |
| Immigrants | Uganda | 95.3 /100 | #117 | Exceptional 11.7% |
| Ecuadorians | 95.3 /100 | #118 | Exceptional 11.7% |
| Syrians | 95.1 /100 | #119 | Exceptional 11.7% |
| Iraqis | 94.6 /100 | #120 | Exceptional 11.8% |