Immigrants from Scotland vs Pennsylvania German Divorced or Separated
COMPARE
Immigrants from Scotland
Pennsylvania German
Divorced or Separated
Divorced or Separated Comparison
Immigrants from Scotland
Pennsylvania Germans
12.0%
DIVORCED OR SEPARATED
65.8/ 100
METRIC RATING
160th/ 347
METRIC RANK
12.1%
DIVORCED OR SEPARATED
48.9/ 100
METRIC RATING
176th/ 347
METRIC RANK
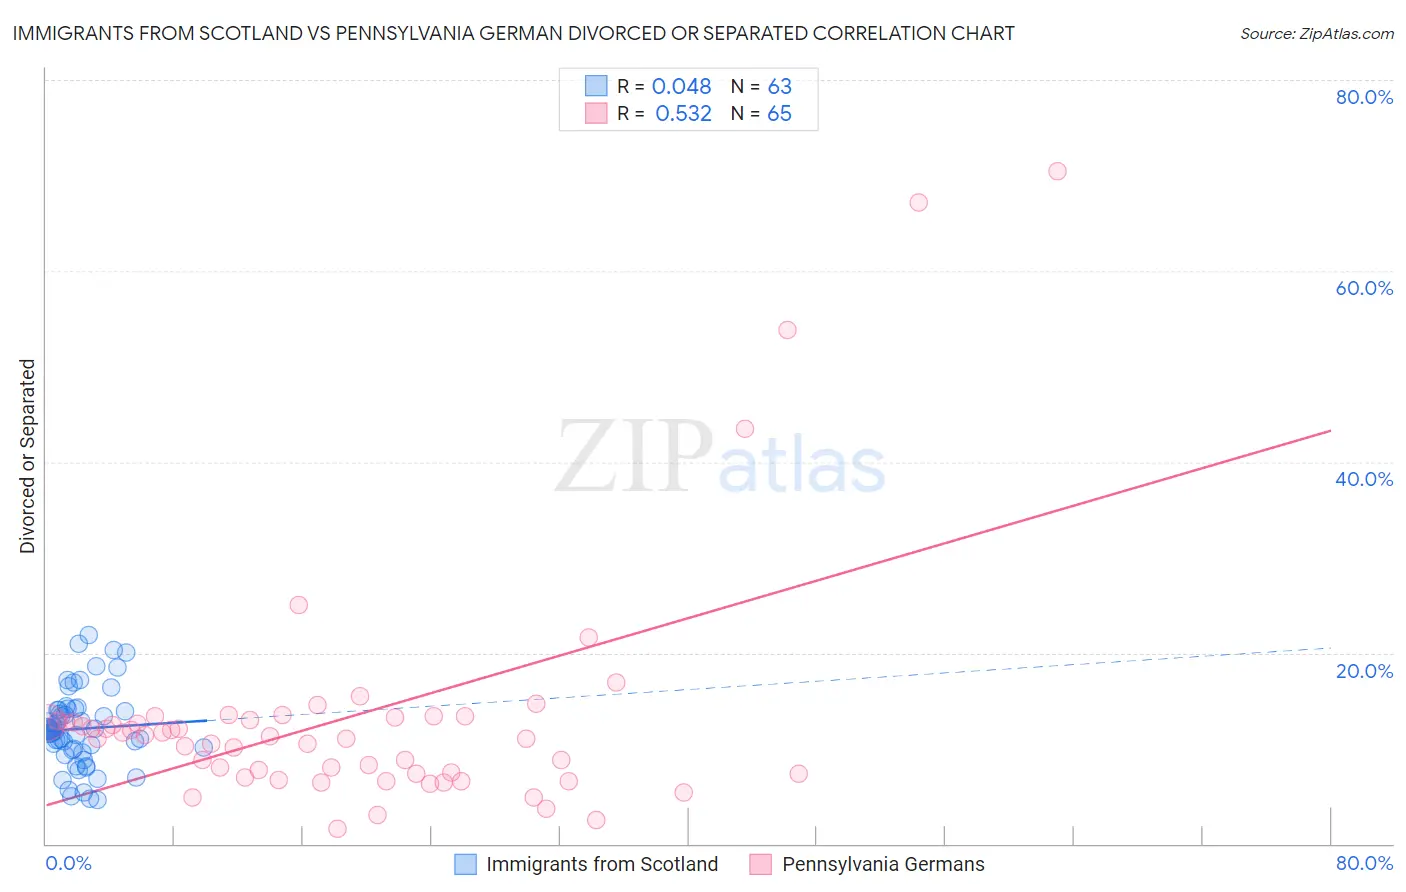
Immigrants from Scotland vs Pennsylvania German Divorced or Separated Correlation Chart
The statistical analysis conducted on geographies consisting of 196,385,271 people shows no correlation between the proportion of Immigrants from Scotland and percentage of population currently divorced or separated in the United States with a correlation coefficient (R) of 0.048 and weighted average of 12.0%. Similarly, the statistical analysis conducted on geographies consisting of 234,077,990 people shows a substantial positive correlation between the proportion of Pennsylvania Germans and percentage of population currently divorced or separated in the United States with a correlation coefficient (R) of 0.532 and weighted average of 12.1%, a difference of 0.61%.
Divorced or Separated Correlation Summary
| Measurement | Immigrants from Scotland | Pennsylvania German |
| Minimum | 4.6% | 1.6% |
| Maximum | 21.8% | 70.4% |
| Range | 17.2% | 68.8% |
| Mean | 12.0% | 13.3% |
| Median | 11.9% | 11.2% |
| Interquartile 25% (IQ1) | 9.8% | 7.3% |
| Interquartile 75% (IQ3) | 14.1% | 13.1% |
| Interquartile Range (IQR) | 4.2% | 5.8% |
| Standard Deviation (Sample) | 4.0% | 12.7% |
| Standard Deviation (Population) | 4.0% | 12.6% |
Demographics Similar to Immigrants from Scotland and Pennsylvania Germans by Divorced or Separated
In terms of divorced or separated, the demographic groups most similar to Immigrants from Scotland are Icelander (12.0%, a difference of 0.010%), Immigrants from Barbados (12.0%, a difference of 0.010%), Marshallese (12.0%, a difference of 0.040%), Samoan (12.0%, a difference of 0.060%), and Navajo (12.0%, a difference of 0.070%). Similarly, the demographic groups most similar to Pennsylvania Germans are Hawaiian (12.1%, a difference of 0.040%), Immigrants from Sierra Leone (12.1%, a difference of 0.040%), Brazilian (12.1%, a difference of 0.040%), Immigrants from Moldova (12.1%, a difference of 0.050%), and Ghanaian (12.1%, a difference of 0.11%).
| Demographics | Rating | Rank | Divorced or Separated |
| Icelanders | 66.0 /100 | #158 | Good 12.0% |
| Immigrants | Barbados | 66.0 /100 | #159 | Good 12.0% |
| Immigrants | Scotland | 65.8 /100 | #160 | Good 12.0% |
| Marshallese | 64.6 /100 | #161 | Good 12.0% |
| Samoans | 64.3 /100 | #162 | Good 12.0% |
| Navajo | 63.9 /100 | #163 | Good 12.0% |
| Swiss | 63.6 /100 | #164 | Good 12.0% |
| German Russians | 61.8 /100 | #165 | Good 12.0% |
| Tohono O'odham | 60.4 /100 | #166 | Good 12.0% |
| Ethiopians | 58.5 /100 | #167 | Average 12.0% |
| Serbians | 57.1 /100 | #168 | Average 12.0% |
| Immigrants | Peru | 57.0 /100 | #169 | Average 12.0% |
| Mexican American Indians | 55.8 /100 | #170 | Average 12.0% |
| Costa Ricans | 53.3 /100 | #171 | Average 12.0% |
| Immigrants | Mexico | 53.2 /100 | #172 | Average 12.0% |
| Immigrants | Moldova | 50.4 /100 | #173 | Average 12.1% |
| Hawaiians | 50.0 /100 | #174 | Average 12.1% |
| Immigrants | Sierra Leone | 50.0 /100 | #175 | Average 12.1% |
| Pennsylvania Germans | 48.9 /100 | #176 | Average 12.1% |
| Brazilians | 47.7 /100 | #177 | Average 12.1% |
| Ghanaians | 45.9 /100 | #178 | Average 12.1% |