Immigrants from Scotland vs Estonian High School Diploma
COMPARE
Immigrants from Scotland
Estonian
High School Diploma
High School Diploma Comparison
Immigrants from Scotland
Estonians
91.3%
HIGH SCHOOL DIPLOMA
99.8/ 100
METRIC RATING
38th/ 347
METRIC RANK
91.6%
HIGH SCHOOL DIPLOMA
99.9/ 100
METRIC RATING
22nd/ 347
METRIC RANK
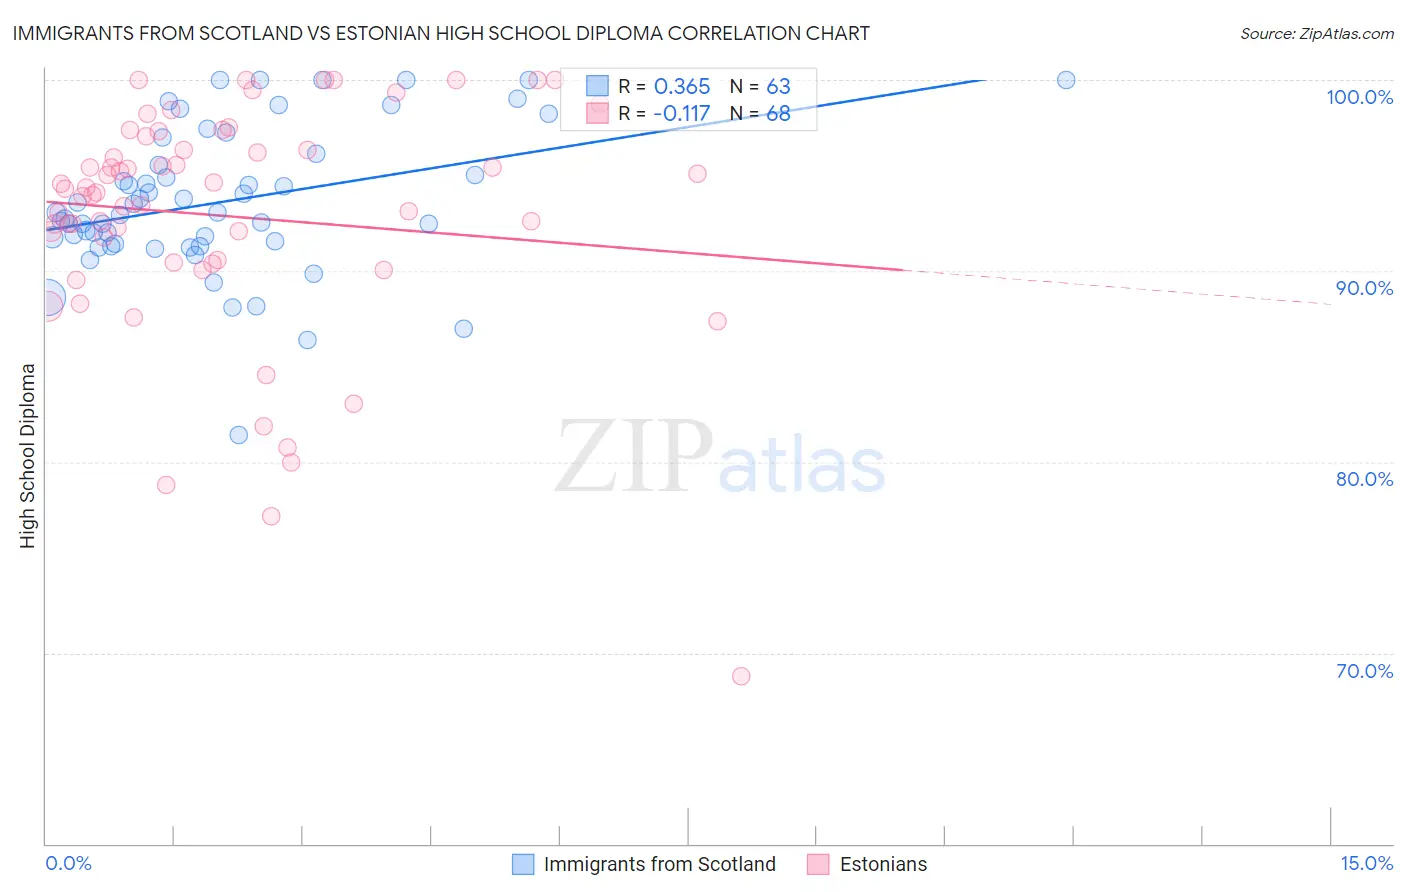
Immigrants from Scotland vs Estonian High School Diploma Correlation Chart
The statistical analysis conducted on geographies consisting of 196,397,786 people shows a mild positive correlation between the proportion of Immigrants from Scotland and percentage of population with at least high school diploma education in the United States with a correlation coefficient (R) of 0.365 and weighted average of 91.3%. Similarly, the statistical analysis conducted on geographies consisting of 123,527,724 people shows a poor negative correlation between the proportion of Estonians and percentage of population with at least high school diploma education in the United States with a correlation coefficient (R) of -0.117 and weighted average of 91.6%, a difference of 0.27%.
High School Diploma Correlation Summary
| Measurement | Immigrants from Scotland | Estonian |
| Minimum | 81.4% | 68.8% |
| Maximum | 100.0% | 100.0% |
| Range | 18.6% | 31.2% |
| Mean | 93.6% | 92.9% |
| Median | 93.0% | 94.2% |
| Interquartile 25% (IQ1) | 91.4% | 90.5% |
| Interquartile 75% (IQ3) | 96.1% | 96.7% |
| Interquartile Range (IQR) | 4.7% | 6.2% |
| Standard Deviation (Sample) | 3.8% | 6.1% |
| Standard Deviation (Population) | 3.8% | 6.1% |
Demographics Similar to Immigrants from Scotland and Estonians by High School Diploma
In terms of high school diploma, the demographic groups most similar to Immigrants from Scotland are Immigrants from Ireland (91.3%, a difference of 0.020%), Dutch (91.3%, a difference of 0.020%), Immigrants from Lithuania (91.3%, a difference of 0.020%), Tsimshian (91.3%, a difference of 0.040%), and Irish (91.4%, a difference of 0.070%). Similarly, the demographic groups most similar to Estonians are Filipino (91.6%, a difference of 0.010%), Czech (91.6%, a difference of 0.020%), Scandinavian (91.5%, a difference of 0.030%), Italian (91.5%, a difference of 0.030%), and Thai (91.5%, a difference of 0.030%).
| Demographics | Rating | Rank | High School Diploma |
| Czechs | 99.9 /100 | #20 | Exceptional 91.6% |
| Filipinos | 99.9 /100 | #21 | Exceptional 91.6% |
| Estonians | 99.9 /100 | #22 | Exceptional 91.6% |
| Scandinavians | 99.9 /100 | #23 | Exceptional 91.5% |
| Italians | 99.9 /100 | #24 | Exceptional 91.5% |
| Thais | 99.9 /100 | #25 | Exceptional 91.5% |
| Russians | 99.9 /100 | #26 | Exceptional 91.5% |
| Cypriots | 99.9 /100 | #27 | Exceptional 91.5% |
| Tlingit-Haida | 99.9 /100 | #28 | Exceptional 91.4% |
| Europeans | 99.9 /100 | #29 | Exceptional 91.4% |
| Iranians | 99.9 /100 | #30 | Exceptional 91.4% |
| Immigrants | Northern Europe | 99.9 /100 | #31 | Exceptional 91.4% |
| English | 99.9 /100 | #32 | Exceptional 91.4% |
| Okinawans | 99.9 /100 | #33 | Exceptional 91.4% |
| Scottish | 99.9 /100 | #34 | Exceptional 91.4% |
| Irish | 99.9 /100 | #35 | Exceptional 91.4% |
| Tsimshian | 99.9 /100 | #36 | Exceptional 91.3% |
| Immigrants | Ireland | 99.9 /100 | #37 | Exceptional 91.3% |
| Immigrants | Scotland | 99.8 /100 | #38 | Exceptional 91.3% |
| Dutch | 99.8 /100 | #39 | Exceptional 91.3% |
| Immigrants | Lithuania | 99.8 /100 | #40 | Exceptional 91.3% |