Irish vs Belgian Average Family Size
COMPARE
Irish
Belgian
Average Family Size
Average Family Size Comparison
Irish
Belgians
3.10
AVERAGE FAMILY SIZE
0.0/ 100
METRIC RATING
336th/ 347
METRIC RANK
3.11
AVERAGE FAMILY SIZE
0.0/ 100
METRIC RATING
329th/ 347
METRIC RANK
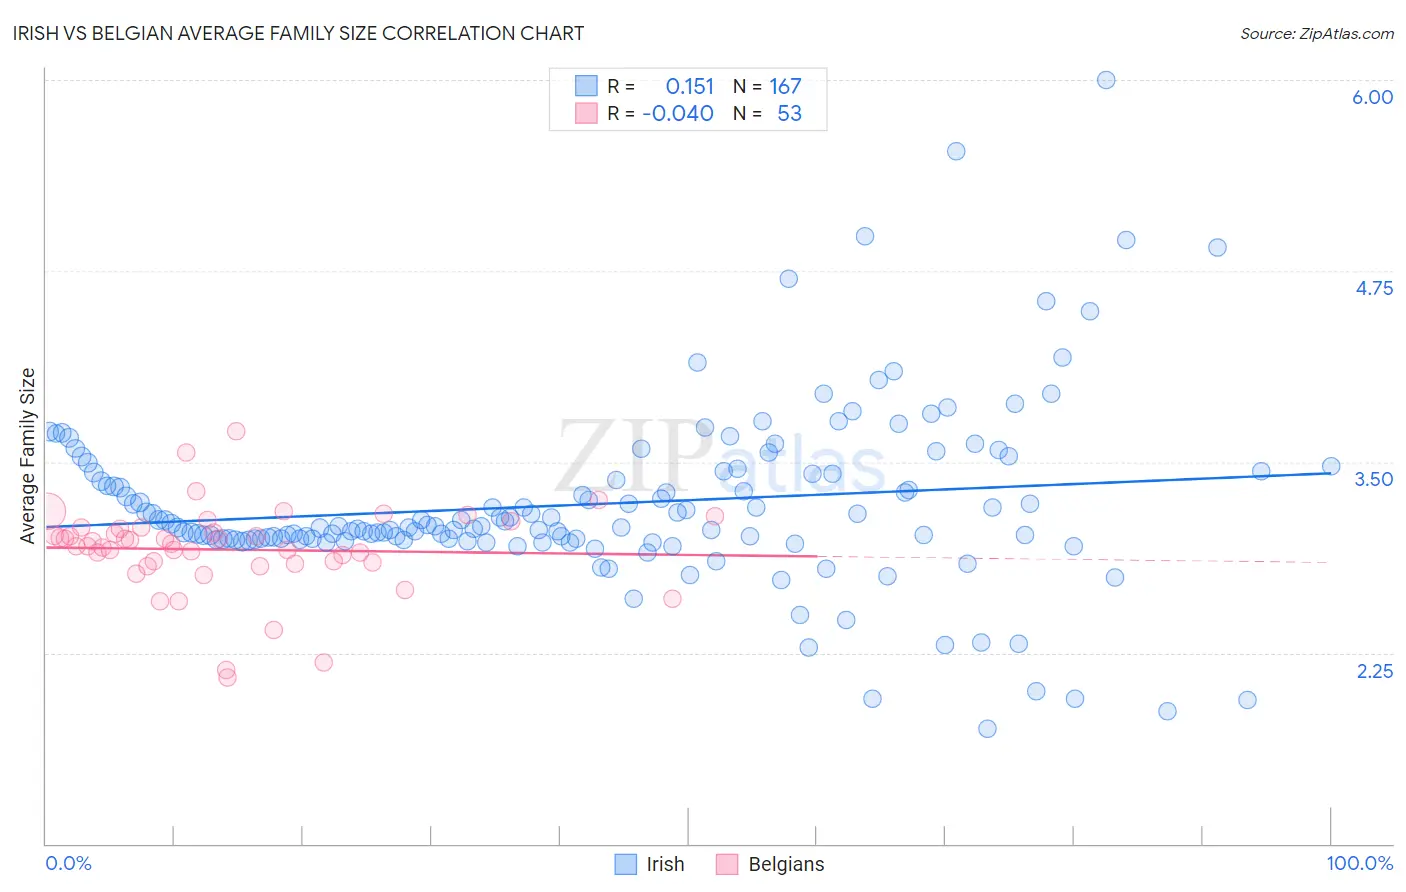
Irish vs Belgian Average Family Size Correlation Chart
The statistical analysis conducted on geographies consisting of 580,016,096 people shows a poor positive correlation between the proportion of Irish and average family size in the United States with a correlation coefficient (R) of 0.151 and weighted average of 3.10. Similarly, the statistical analysis conducted on geographies consisting of 355,849,592 people shows no correlation between the proportion of Belgians and average family size in the United States with a correlation coefficient (R) of -0.040 and weighted average of 3.11, a difference of 0.20%.
Average Family Size Correlation Summary
| Measurement | Irish | Belgian |
| Minimum | 1.75 | 2.09 |
| Maximum | 6.00 | 3.70 |
| Range | 4.25 | 1.61 |
| Mean | 3.22 | 2.93 |
| Median | 3.08 | 2.96 |
| Interquartile 25% (IQ1) | 2.99 | 2.83 |
| Interquartile 75% (IQ3) | 3.43 | 3.07 |
| Interquartile Range (IQR) | 0.44 | 0.23 |
| Standard Deviation (Sample) | 0.59 | 0.29 |
| Standard Deviation (Population) | 0.59 | 0.29 |
Demographics Similar to Irish and Belgians by Average Family Size
In terms of average family size, the demographic groups most similar to Irish are Swedish (3.10, a difference of 0.030%), Luxembourger (3.10, a difference of 0.060%), French (3.10, a difference of 0.060%), Croatian (3.10, a difference of 0.070%), and Estonian (3.10, a difference of 0.090%). Similarly, the demographic groups most similar to Belgians are Dutch (3.11, a difference of 0.060%), Czech (3.11, a difference of 0.060%), Latvian (3.11, a difference of 0.060%), Scotch-Irish (3.11, a difference of 0.060%), and Scottish (3.11, a difference of 0.060%).
| Demographics | Rating | Rank | Average Family Size |
| Immigrants | Canada | 0.0 /100 | #322 | Tragic 3.12 |
| Soviet Union | 0.0 /100 | #323 | Tragic 3.11 |
| Celtics | 0.0 /100 | #324 | Tragic 3.11 |
| English | 0.0 /100 | #325 | Tragic 3.11 |
| Ottawa | 0.0 /100 | #326 | Tragic 3.11 |
| Dutch | 0.0 /100 | #327 | Tragic 3.11 |
| Czechs | 0.0 /100 | #328 | Tragic 3.11 |
| Belgians | 0.0 /100 | #329 | Tragic 3.11 |
| Latvians | 0.0 /100 | #330 | Tragic 3.11 |
| Scotch-Irish | 0.0 /100 | #331 | Tragic 3.11 |
| Scottish | 0.0 /100 | #332 | Tragic 3.11 |
| Estonians | 0.0 /100 | #333 | Tragic 3.10 |
| Lithuanians | 0.0 /100 | #334 | Tragic 3.10 |
| Luxembourgers | 0.0 /100 | #335 | Tragic 3.10 |
| Irish | 0.0 /100 | #336 | Tragic 3.10 |
| Swedes | 0.0 /100 | #337 | Tragic 3.10 |
| French | 0.0 /100 | #338 | Tragic 3.10 |
| Croatians | 0.0 /100 | #339 | Tragic 3.10 |
| Finns | 0.0 /100 | #340 | Tragic 3.09 |
| Poles | 0.0 /100 | #341 | Tragic 3.09 |
| Germans | 0.0 /100 | #342 | Tragic 3.09 |