Immigrants from Saudi Arabia vs Armenian Divorced or Separated
COMPARE
Immigrants from Saudi Arabia
Armenian
Divorced or Separated
Divorced or Separated Comparison
Immigrants from Saudi Arabia
Armenians
11.2%
DIVORCED OR SEPARATED
100.0/ 100
METRIC RATING
49th/ 347
METRIC RANK
11.0%
DIVORCED OR SEPARATED
100.0/ 100
METRIC RATING
29th/ 347
METRIC RANK
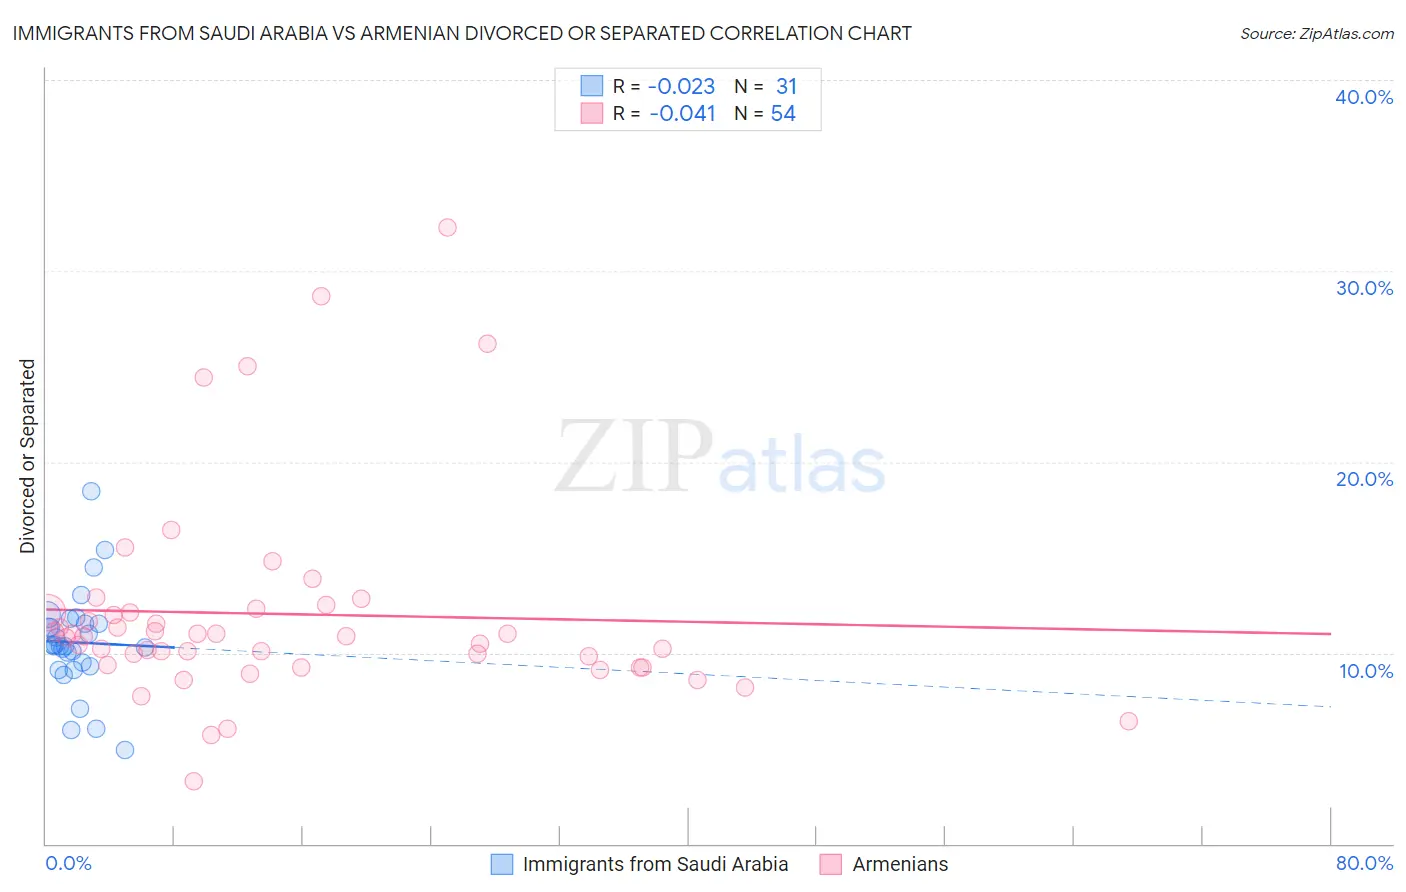
Immigrants from Saudi Arabia vs Armenian Divorced or Separated Correlation Chart
The statistical analysis conducted on geographies consisting of 164,229,737 people shows no correlation between the proportion of Immigrants from Saudi Arabia and percentage of population currently divorced or separated in the United States with a correlation coefficient (R) of -0.023 and weighted average of 11.2%. Similarly, the statistical analysis conducted on geographies consisting of 310,841,863 people shows no correlation between the proportion of Armenians and percentage of population currently divorced or separated in the United States with a correlation coefficient (R) of -0.041 and weighted average of 11.0%, a difference of 2.1%.
Divorced or Separated Correlation Summary
| Measurement | Immigrants from Saudi Arabia | Armenian |
| Minimum | 4.9% | 3.3% |
| Maximum | 18.5% | 32.3% |
| Range | 13.6% | 29.0% |
| Mean | 10.5% | 12.0% |
| Median | 10.4% | 10.9% |
| Interquartile 25% (IQ1) | 9.3% | 9.4% |
| Interquartile 75% (IQ3) | 11.5% | 12.1% |
| Interquartile Range (IQR) | 2.2% | 2.7% |
| Standard Deviation (Sample) | 2.7% | 5.5% |
| Standard Deviation (Population) | 2.6% | 5.4% |
Demographics Similar to Immigrants from Saudi Arabia and Armenians by Divorced or Separated
In terms of divorced or separated, the demographic groups most similar to Immigrants from Saudi Arabia are Immigrants from Turkey (11.2%, a difference of 0.010%), Immigrants from Poland (11.2%, a difference of 0.040%), Laotian (11.2%, a difference of 0.050%), Turkish (11.2%, a difference of 0.16%), and Immigrants from Western Asia (11.2%, a difference of 0.20%). Similarly, the demographic groups most similar to Armenians are Immigrants from Ireland (11.0%, a difference of 0.52%), Mongolian (11.1%, a difference of 0.82%), Tongan (11.1%, a difference of 0.90%), Egyptian (11.1%, a difference of 0.94%), and Immigrants from Uzbekistan (11.1%, a difference of 1.0%).
| Demographics | Rating | Rank | Divorced or Separated |
| Armenians | 100.0 /100 | #29 | Exceptional 11.0% |
| Immigrants | Ireland | 100.0 /100 | #30 | Exceptional 11.0% |
| Mongolians | 100.0 /100 | #31 | Exceptional 11.1% |
| Tongans | 100.0 /100 | #32 | Exceptional 11.1% |
| Egyptians | 100.0 /100 | #33 | Exceptional 11.1% |
| Immigrants | Uzbekistan | 100.0 /100 | #34 | Exceptional 11.1% |
| Cambodians | 100.0 /100 | #35 | Exceptional 11.1% |
| Immigrants | Japan | 100.0 /100 | #36 | Exceptional 11.1% |
| Immigrants | Lebanon | 100.0 /100 | #37 | Exceptional 11.1% |
| Immigrants | Greece | 100.0 /100 | #38 | Exceptional 11.1% |
| Immigrants | Egypt | 100.0 /100 | #39 | Exceptional 11.1% |
| Soviet Union | 100.0 /100 | #40 | Exceptional 11.1% |
| Bhutanese | 100.0 /100 | #41 | Exceptional 11.2% |
| Chinese | 100.0 /100 | #42 | Exceptional 11.2% |
| Immigrants | Belarus | 100.0 /100 | #43 | Exceptional 11.2% |
| Immigrants | Western Asia | 100.0 /100 | #44 | Exceptional 11.2% |
| Turks | 100.0 /100 | #45 | Exceptional 11.2% |
| Laotians | 100.0 /100 | #46 | Exceptional 11.2% |
| Immigrants | Poland | 100.0 /100 | #47 | Exceptional 11.2% |
| Immigrants | Turkey | 100.0 /100 | #48 | Exceptional 11.2% |
| Immigrants | Saudi Arabia | 100.0 /100 | #49 | Exceptional 11.2% |