Immigrants from Saudi Arabia vs German Single Mother Households
COMPARE
Immigrants from Saudi Arabia
German
Single Mother Households
Single Mother Households Comparison
Immigrants from Saudi Arabia
Germans
5.9%
SINGLE MOTHER HOUSEHOLDS
90.2/ 100
METRIC RATING
135th/ 347
METRIC RANK
5.8%
SINGLE MOTHER HOUSEHOLDS
96.2/ 100
METRIC RATING
101st/ 347
METRIC RANK
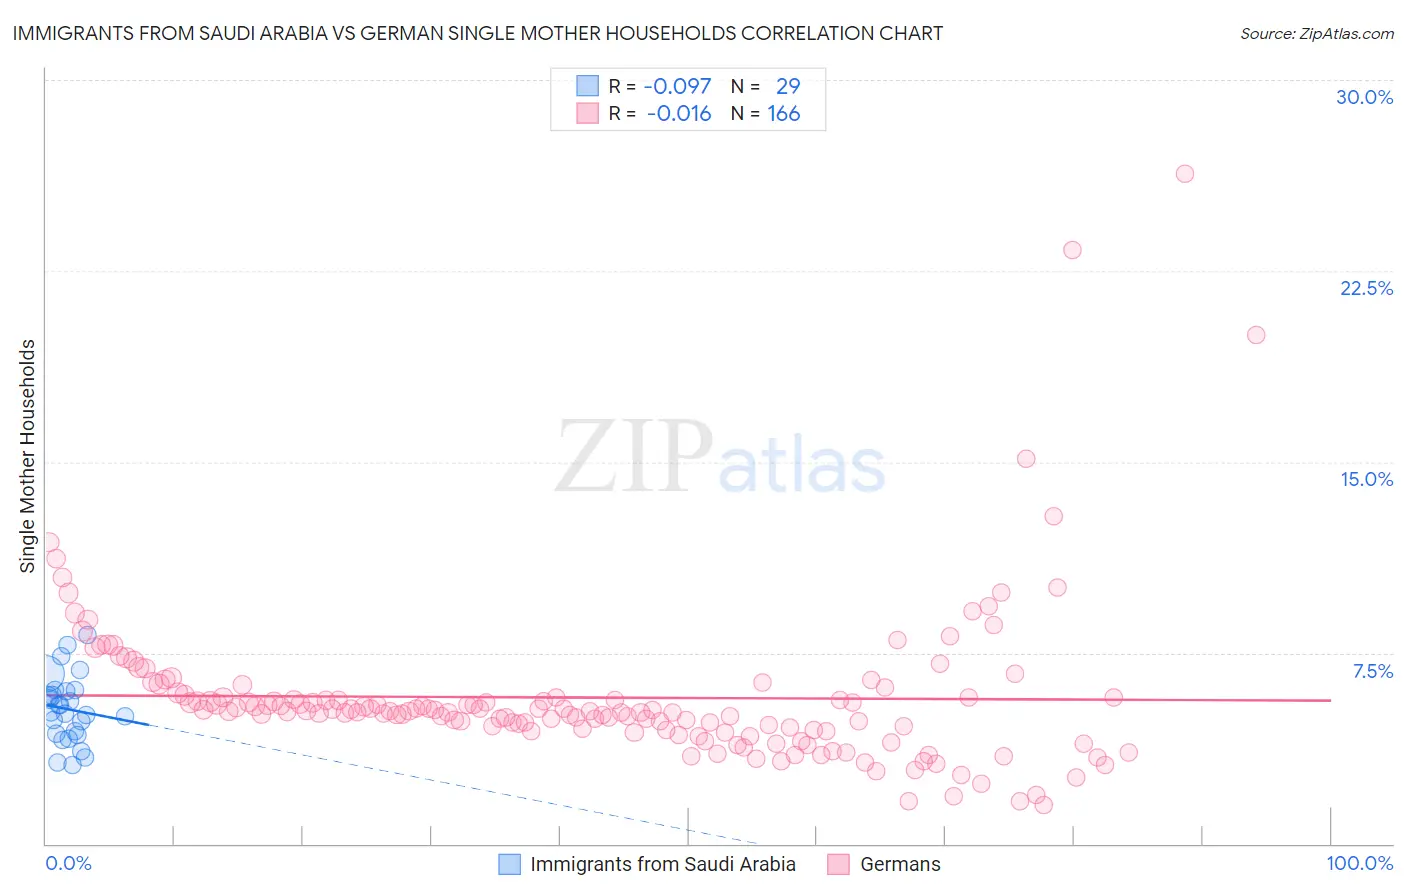
Immigrants from Saudi Arabia vs German Single Mother Households Correlation Chart
The statistical analysis conducted on geographies consisting of 164,140,897 people shows a slight negative correlation between the proportion of Immigrants from Saudi Arabia and percentage of single mother households in the United States with a correlation coefficient (R) of -0.097 and weighted average of 5.9%. Similarly, the statistical analysis conducted on geographies consisting of 574,074,235 people shows no correlation between the proportion of Germans and percentage of single mother households in the United States with a correlation coefficient (R) of -0.016 and weighted average of 5.8%, a difference of 3.0%.
Single Mother Households Correlation Summary
| Measurement | Immigrants from Saudi Arabia | German |
| Minimum | 3.1% | 1.5% |
| Maximum | 8.2% | 26.3% |
| Range | 5.1% | 24.8% |
| Mean | 5.3% | 5.7% |
| Median | 5.1% | 5.2% |
| Interquartile 25% (IQ1) | 4.3% | 4.5% |
| Interquartile 75% (IQ3) | 6.0% | 5.8% |
| Interquartile Range (IQR) | 1.7% | 1.3% |
| Standard Deviation (Sample) | 1.3% | 3.1% |
| Standard Deviation (Population) | 1.3% | 3.1% |
Similar Demographics by Single Mother Households
Demographics Similar to Immigrants from Saudi Arabia by Single Mother Households
In terms of single mother households, the demographic groups most similar to Immigrants from Saudi Arabia are Canadian (5.9%, a difference of 0.090%), Egyptian (5.9%, a difference of 0.15%), Albanian (5.9%, a difference of 0.31%), Immigrants from Spain (5.9%, a difference of 0.35%), and Jordanian (6.0%, a difference of 0.42%).
| Demographics | Rating | Rank | Single Mother Households |
| Czechoslovakians | 92.2 /100 | #128 | Exceptional 5.9% |
| Immigrants | Bolivia | 92.2 /100 | #129 | Exceptional 5.9% |
| Palestinians | 92.1 /100 | #130 | Exceptional 5.9% |
| Immigrants | Spain | 91.2 /100 | #131 | Exceptional 5.9% |
| Albanians | 91.1 /100 | #132 | Exceptional 5.9% |
| Egyptians | 90.7 /100 | #133 | Exceptional 5.9% |
| Canadians | 90.5 /100 | #134 | Exceptional 5.9% |
| Immigrants | Saudi Arabia | 90.2 /100 | #135 | Exceptional 5.9% |
| Jordanians | 88.9 /100 | #136 | Excellent 6.0% |
| Immigrants | Pakistan | 88.4 /100 | #137 | Excellent 6.0% |
| Icelanders | 86.9 /100 | #138 | Excellent 6.0% |
| Syrians | 86.0 /100 | #139 | Excellent 6.0% |
| French | 85.7 /100 | #140 | Excellent 6.0% |
| Tsimshian | 85.2 /100 | #141 | Excellent 6.0% |
| Immigrants | Egypt | 85.0 /100 | #142 | Excellent 6.0% |
Demographics Similar to Germans by Single Mother Households
In terms of single mother households, the demographic groups most similar to Germans are English (5.8%, a difference of 0.0%), Scottish (5.8%, a difference of 0.020%), Scandinavian (5.8%, a difference of 0.030%), Northern European (5.8%, a difference of 0.030%), and Immigrants from Poland (5.8%, a difference of 0.040%).
| Demographics | Rating | Rank | Single Mother Households |
| Basques | 96.7 /100 | #94 | Exceptional 5.7% |
| Slovaks | 96.6 /100 | #95 | Exceptional 5.7% |
| Austrians | 96.4 /100 | #96 | Exceptional 5.7% |
| Tlingit-Haida | 96.4 /100 | #97 | Exceptional 5.7% |
| Immigrants | South Africa | 96.3 /100 | #98 | Exceptional 5.7% |
| Immigrants | Poland | 96.3 /100 | #99 | Exceptional 5.8% |
| Scandinavians | 96.2 /100 | #100 | Exceptional 5.8% |
| Germans | 96.2 /100 | #101 | Exceptional 5.8% |
| English | 96.2 /100 | #102 | Exceptional 5.8% |
| Scottish | 96.2 /100 | #103 | Exceptional 5.8% |
| Northern Europeans | 96.2 /100 | #104 | Exceptional 5.8% |
| Taiwanese | 96.1 /100 | #105 | Exceptional 5.8% |
| Immigrants | Ukraine | 95.9 /100 | #106 | Exceptional 5.8% |
| Paraguayans | 95.8 /100 | #107 | Exceptional 5.8% |
| Immigrants | Italy | 95.8 /100 | #108 | Exceptional 5.8% |