Immigrants from Saudi Arabia vs Arab Single Mother Households
COMPARE
Immigrants from Saudi Arabia
Arab
Single Mother Households
Single Mother Households Comparison
Immigrants from Saudi Arabia
Arabs
5.9%
SINGLE MOTHER HOUSEHOLDS
90.2/ 100
METRIC RATING
135th/ 347
METRIC RANK
6.0%
SINGLE MOTHER HOUSEHOLDS
84.0/ 100
METRIC RATING
145th/ 347
METRIC RANK
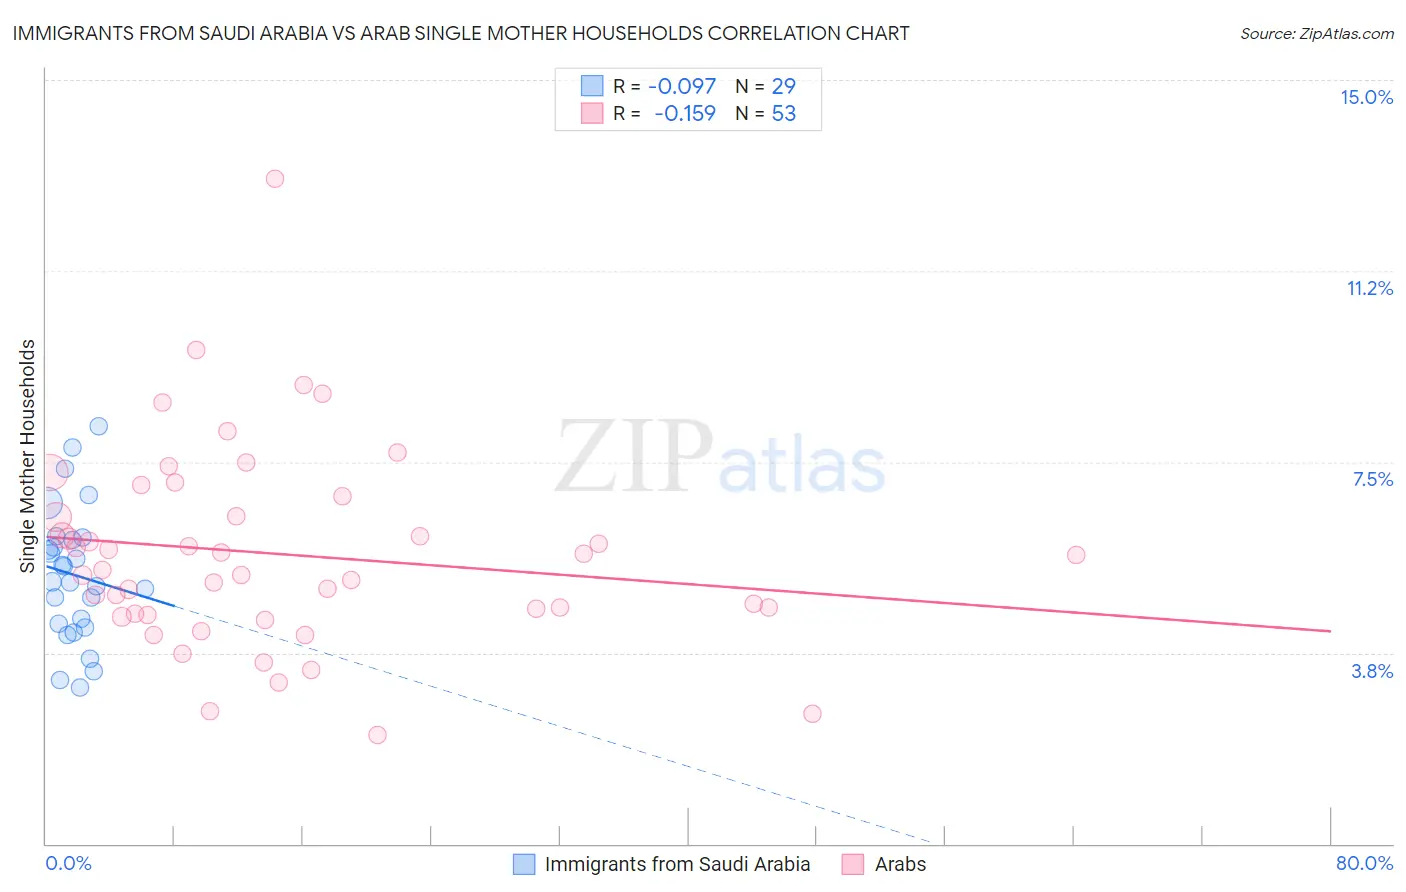
Immigrants from Saudi Arabia vs Arab Single Mother Households Correlation Chart
The statistical analysis conducted on geographies consisting of 164,140,897 people shows a slight negative correlation between the proportion of Immigrants from Saudi Arabia and percentage of single mother households in the United States with a correlation coefficient (R) of -0.097 and weighted average of 5.9%. Similarly, the statistical analysis conducted on geographies consisting of 484,798,237 people shows a poor negative correlation between the proportion of Arabs and percentage of single mother households in the United States with a correlation coefficient (R) of -0.159 and weighted average of 6.0%, a difference of 1.6%.
Single Mother Households Correlation Summary
| Measurement | Immigrants from Saudi Arabia | Arab |
| Minimum | 3.1% | 2.1% |
| Maximum | 8.2% | 13.1% |
| Range | 5.1% | 10.9% |
| Mean | 5.3% | 5.7% |
| Median | 5.1% | 5.4% |
| Interquartile 25% (IQ1) | 4.3% | 4.5% |
| Interquartile 75% (IQ3) | 6.0% | 6.6% |
| Interquartile Range (IQR) | 1.7% | 2.1% |
| Standard Deviation (Sample) | 1.3% | 2.0% |
| Standard Deviation (Population) | 1.3% | 1.9% |
Demographics Similar to Immigrants from Saudi Arabia and Arabs by Single Mother Households
In terms of single mother households, the demographic groups most similar to Immigrants from Saudi Arabia are Canadian (5.9%, a difference of 0.090%), Egyptian (5.9%, a difference of 0.15%), Albanian (5.9%, a difference of 0.31%), Immigrants from Spain (5.9%, a difference of 0.35%), and Jordanian (6.0%, a difference of 0.42%). Similarly, the demographic groups most similar to Arabs are Korean (6.0%, a difference of 0.090%), Immigrants from Iraq (6.0%, a difference of 0.19%), Immigrants from Egypt (6.0%, a difference of 0.23%), Tsimshian (6.0%, a difference of 0.28%), and French Canadian (6.0%, a difference of 0.29%).
| Demographics | Rating | Rank | Single Mother Households |
| Palestinians | 92.1 /100 | #130 | Exceptional 5.9% |
| Immigrants | Spain | 91.2 /100 | #131 | Exceptional 5.9% |
| Albanians | 91.1 /100 | #132 | Exceptional 5.9% |
| Egyptians | 90.7 /100 | #133 | Exceptional 5.9% |
| Canadians | 90.5 /100 | #134 | Exceptional 5.9% |
| Immigrants | Saudi Arabia | 90.2 /100 | #135 | Exceptional 5.9% |
| Jordanians | 88.9 /100 | #136 | Excellent 6.0% |
| Immigrants | Pakistan | 88.4 /100 | #137 | Excellent 6.0% |
| Icelanders | 86.9 /100 | #138 | Excellent 6.0% |
| Syrians | 86.0 /100 | #139 | Excellent 6.0% |
| French | 85.7 /100 | #140 | Excellent 6.0% |
| Tsimshian | 85.2 /100 | #141 | Excellent 6.0% |
| Immigrants | Egypt | 85.0 /100 | #142 | Excellent 6.0% |
| Immigrants | Iraq | 84.8 /100 | #143 | Excellent 6.0% |
| Koreans | 84.4 /100 | #144 | Excellent 6.0% |
| Arabs | 84.0 /100 | #145 | Excellent 6.0% |
| French Canadians | 82.6 /100 | #146 | Excellent 6.0% |
| Immigrants | Jordan | 82.3 /100 | #147 | Excellent 6.0% |
| Scotch-Irish | 82.0 /100 | #148 | Excellent 6.0% |
| Immigrants | Albania | 81.5 /100 | #149 | Excellent 6.1% |
| Zimbabweans | 80.7 /100 | #150 | Excellent 6.1% |