Immigrants from Indonesia vs German Single Mother Households
COMPARE
Immigrants from Indonesia
German
Single Mother Households
Single Mother Households Comparison
Immigrants from Indonesia
Germans
5.7%
SINGLE MOTHER HOUSEHOLDS
97.2/ 100
METRIC RATING
90th/ 347
METRIC RANK
5.8%
SINGLE MOTHER HOUSEHOLDS
96.2/ 100
METRIC RATING
101st/ 347
METRIC RANK
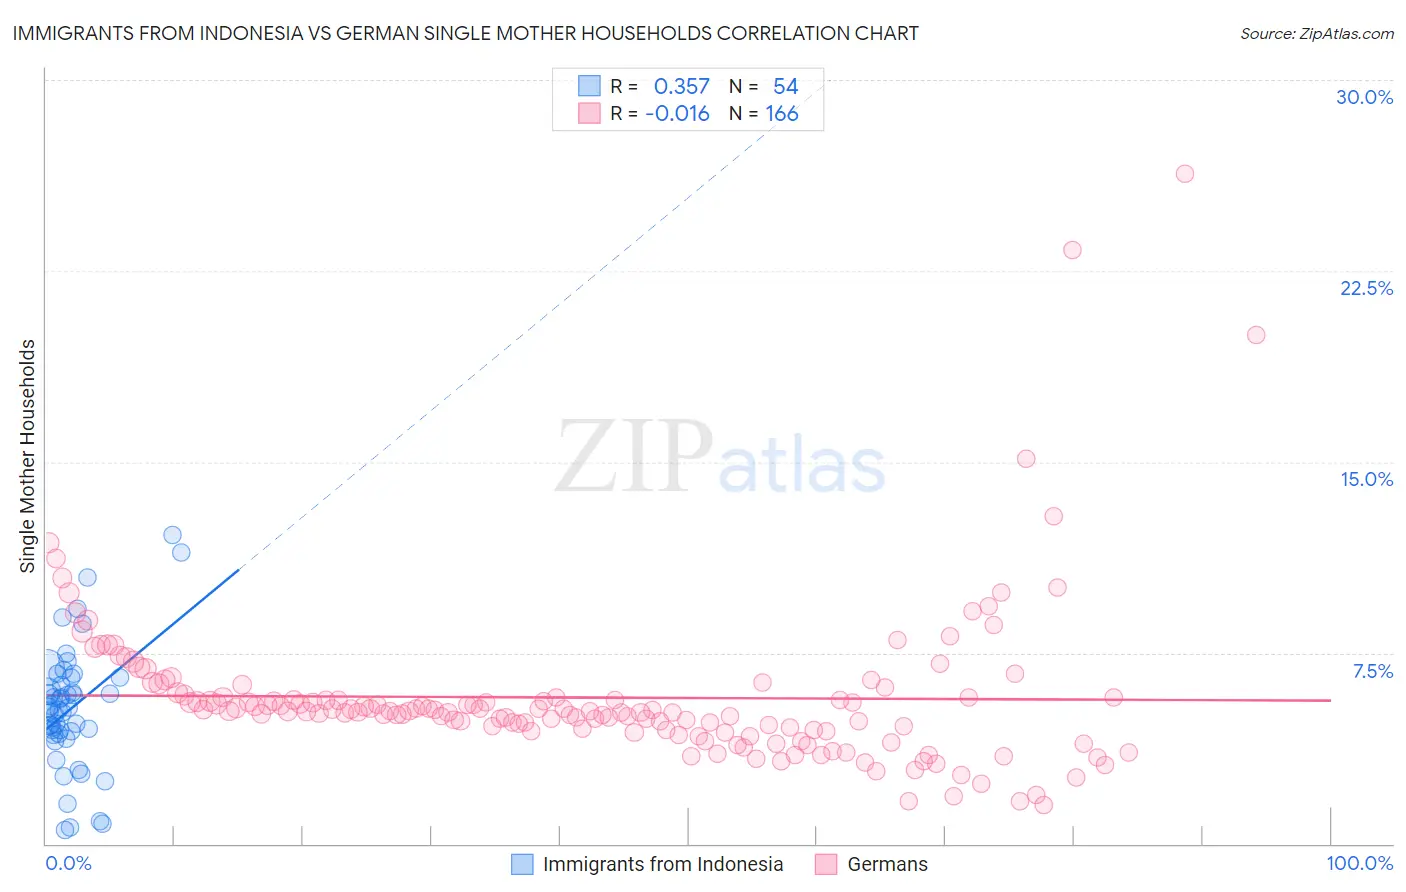
Immigrants from Indonesia vs German Single Mother Households Correlation Chart
The statistical analysis conducted on geographies consisting of 215,530,702 people shows a mild positive correlation between the proportion of Immigrants from Indonesia and percentage of single mother households in the United States with a correlation coefficient (R) of 0.357 and weighted average of 5.7%. Similarly, the statistical analysis conducted on geographies consisting of 574,074,235 people shows no correlation between the proportion of Germans and percentage of single mother households in the United States with a correlation coefficient (R) of -0.016 and weighted average of 5.8%, a difference of 0.92%.
Single Mother Households Correlation Summary
| Measurement | Immigrants from Indonesia | German |
| Minimum | 0.52% | 1.5% |
| Maximum | 12.1% | 26.3% |
| Range | 11.6% | 24.8% |
| Mean | 5.3% | 5.7% |
| Median | 5.3% | 5.2% |
| Interquartile 25% (IQ1) | 4.3% | 4.5% |
| Interquartile 75% (IQ3) | 6.5% | 5.8% |
| Interquartile Range (IQR) | 2.2% | 1.3% |
| Standard Deviation (Sample) | 2.4% | 3.1% |
| Standard Deviation (Population) | 2.4% | 3.1% |
Demographics Similar to Immigrants from Indonesia and Germans by Single Mother Households
In terms of single mother households, the demographic groups most similar to Immigrants from Indonesia are Ukrainian (5.7%, a difference of 0.060%), European (5.7%, a difference of 0.22%), Israeli (5.7%, a difference of 0.32%), Immigrants from Turkey (5.7%, a difference of 0.39%), and Immigrants from Western Asia (5.7%, a difference of 0.45%). Similarly, the demographic groups most similar to Germans are English (5.8%, a difference of 0.0%), Scottish (5.8%, a difference of 0.020%), Scandinavian (5.8%, a difference of 0.030%), Northern European (5.8%, a difference of 0.030%), and Immigrants from Poland (5.8%, a difference of 0.040%).
| Demographics | Rating | Rank | Single Mother Households |
| Hungarians | 97.6 /100 | #85 | Exceptional 5.7% |
| Finns | 97.6 /100 | #86 | Exceptional 5.7% |
| Immigrants | Turkey | 97.5 /100 | #87 | Exceptional 5.7% |
| Israelis | 97.4 /100 | #88 | Exceptional 5.7% |
| Ukrainians | 97.2 /100 | #89 | Exceptional 5.7% |
| Immigrants | Indonesia | 97.2 /100 | #90 | Exceptional 5.7% |
| Europeans | 97.0 /100 | #91 | Exceptional 5.7% |
| Immigrants | Western Asia | 96.7 /100 | #92 | Exceptional 5.7% |
| Serbians | 96.7 /100 | #93 | Exceptional 5.7% |
| Basques | 96.7 /100 | #94 | Exceptional 5.7% |
| Slovaks | 96.6 /100 | #95 | Exceptional 5.7% |
| Austrians | 96.4 /100 | #96 | Exceptional 5.7% |
| Tlingit-Haida | 96.4 /100 | #97 | Exceptional 5.7% |
| Immigrants | South Africa | 96.3 /100 | #98 | Exceptional 5.7% |
| Immigrants | Poland | 96.3 /100 | #99 | Exceptional 5.8% |
| Scandinavians | 96.2 /100 | #100 | Exceptional 5.8% |
| Germans | 96.2 /100 | #101 | Exceptional 5.8% |
| English | 96.2 /100 | #102 | Exceptional 5.8% |
| Scottish | 96.2 /100 | #103 | Exceptional 5.8% |
| Northern Europeans | 96.2 /100 | #104 | Exceptional 5.8% |
| Taiwanese | 96.1 /100 | #105 | Exceptional 5.8% |