Immigrants from Saudi Arabia vs Immigrants from Caribbean Single Mother Households
COMPARE
Immigrants from Saudi Arabia
Immigrants from Caribbean
Single Mother Households
Single Mother Households Comparison
Immigrants from Saudi Arabia
Immigrants from Caribbean
5.9%
SINGLE MOTHER HOUSEHOLDS
90.2/ 100
METRIC RATING
135th/ 347
METRIC RANK
8.4%
SINGLE MOTHER HOUSEHOLDS
0.0/ 100
METRIC RATING
325th/ 347
METRIC RANK
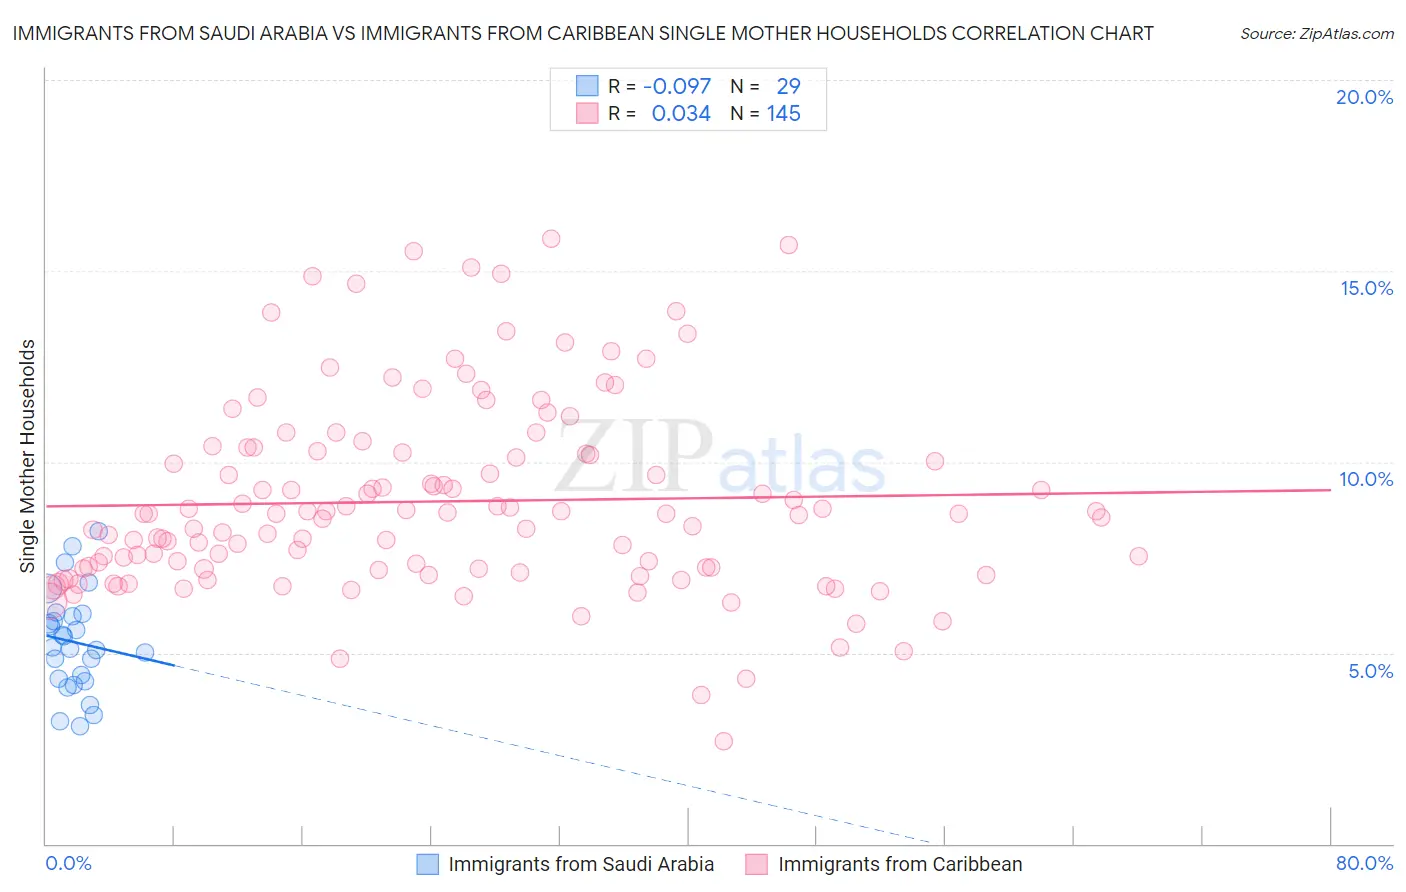
Immigrants from Saudi Arabia vs Immigrants from Caribbean Single Mother Households Correlation Chart
The statistical analysis conducted on geographies consisting of 164,140,897 people shows a slight negative correlation between the proportion of Immigrants from Saudi Arabia and percentage of single mother households in the United States with a correlation coefficient (R) of -0.097 and weighted average of 5.9%. Similarly, the statistical analysis conducted on geographies consisting of 448,351,427 people shows no correlation between the proportion of Immigrants from Caribbean and percentage of single mother households in the United States with a correlation coefficient (R) of 0.034 and weighted average of 8.4%, a difference of 41.3%.
Single Mother Households Correlation Summary
| Measurement | Immigrants from Saudi Arabia | Immigrants from Caribbean |
| Minimum | 3.1% | 2.7% |
| Maximum | 8.2% | 15.8% |
| Range | 5.1% | 13.1% |
| Mean | 5.3% | 9.0% |
| Median | 5.1% | 8.6% |
| Interquartile 25% (IQ1) | 4.3% | 7.2% |
| Interquartile 75% (IQ3) | 6.0% | 10.3% |
| Interquartile Range (IQR) | 1.7% | 3.1% |
| Standard Deviation (Sample) | 1.3% | 2.5% |
| Standard Deviation (Population) | 1.3% | 2.5% |
Similar Demographics by Single Mother Households
Demographics Similar to Immigrants from Saudi Arabia by Single Mother Households
In terms of single mother households, the demographic groups most similar to Immigrants from Saudi Arabia are Canadian (5.9%, a difference of 0.090%), Egyptian (5.9%, a difference of 0.15%), Albanian (5.9%, a difference of 0.31%), Immigrants from Spain (5.9%, a difference of 0.35%), and Jordanian (6.0%, a difference of 0.42%).
| Demographics | Rating | Rank | Single Mother Households |
| Czechoslovakians | 92.2 /100 | #128 | Exceptional 5.9% |
| Immigrants | Bolivia | 92.2 /100 | #129 | Exceptional 5.9% |
| Palestinians | 92.1 /100 | #130 | Exceptional 5.9% |
| Immigrants | Spain | 91.2 /100 | #131 | Exceptional 5.9% |
| Albanians | 91.1 /100 | #132 | Exceptional 5.9% |
| Egyptians | 90.7 /100 | #133 | Exceptional 5.9% |
| Canadians | 90.5 /100 | #134 | Exceptional 5.9% |
| Immigrants | Saudi Arabia | 90.2 /100 | #135 | Exceptional 5.9% |
| Jordanians | 88.9 /100 | #136 | Excellent 6.0% |
| Immigrants | Pakistan | 88.4 /100 | #137 | Excellent 6.0% |
| Icelanders | 86.9 /100 | #138 | Excellent 6.0% |
| Syrians | 86.0 /100 | #139 | Excellent 6.0% |
| French | 85.7 /100 | #140 | Excellent 6.0% |
| Tsimshian | 85.2 /100 | #141 | Excellent 6.0% |
| Immigrants | Egypt | 85.0 /100 | #142 | Excellent 6.0% |
Demographics Similar to Immigrants from Caribbean by Single Mother Households
In terms of single mother households, the demographic groups most similar to Immigrants from Caribbean are British West Indian (8.4%, a difference of 0.12%), Immigrants from Jamaica (8.4%, a difference of 0.18%), Immigrants from Haiti (8.4%, a difference of 0.27%), Yakama (8.4%, a difference of 0.45%), and Haitian (8.3%, a difference of 0.61%).
| Demographics | Rating | Rank | Single Mother Households |
| Senegalese | 0.0 /100 | #318 | Tragic 8.2% |
| Jamaicans | 0.0 /100 | #319 | Tragic 8.2% |
| Bahamians | 0.0 /100 | #320 | Tragic 8.3% |
| Immigrants | Senegal | 0.0 /100 | #321 | Tragic 8.3% |
| Pima | 0.0 /100 | #322 | Tragic 8.3% |
| Haitians | 0.0 /100 | #323 | Tragic 8.3% |
| Immigrants | Jamaica | 0.0 /100 | #324 | Tragic 8.4% |
| Immigrants | Caribbean | 0.0 /100 | #325 | Tragic 8.4% |
| British West Indians | 0.0 /100 | #326 | Tragic 8.4% |
| Immigrants | Haiti | 0.0 /100 | #327 | Tragic 8.4% |
| Yakama | 0.0 /100 | #328 | Tragic 8.4% |
| Hopi | 0.0 /100 | #329 | Tragic 8.5% |
| Inupiat | 0.0 /100 | #330 | Tragic 8.5% |
| Sioux | 0.0 /100 | #331 | Tragic 8.5% |
| U.S. Virgin Islanders | 0.0 /100 | #332 | Tragic 8.6% |