Palestinian vs Tlingit-Haida Divorced or Separated
COMPARE
Palestinian
Tlingit-Haida
Divorced or Separated
Divorced or Separated Comparison
Palestinians
Tlingit-Haida
11.5%
DIVORCED OR SEPARATED
99.7/ 100
METRIC RATING
68th/ 347
METRIC RANK
13.2%
DIVORCED OR SEPARATED
0.0/ 100
METRIC RATING
306th/ 347
METRIC RANK
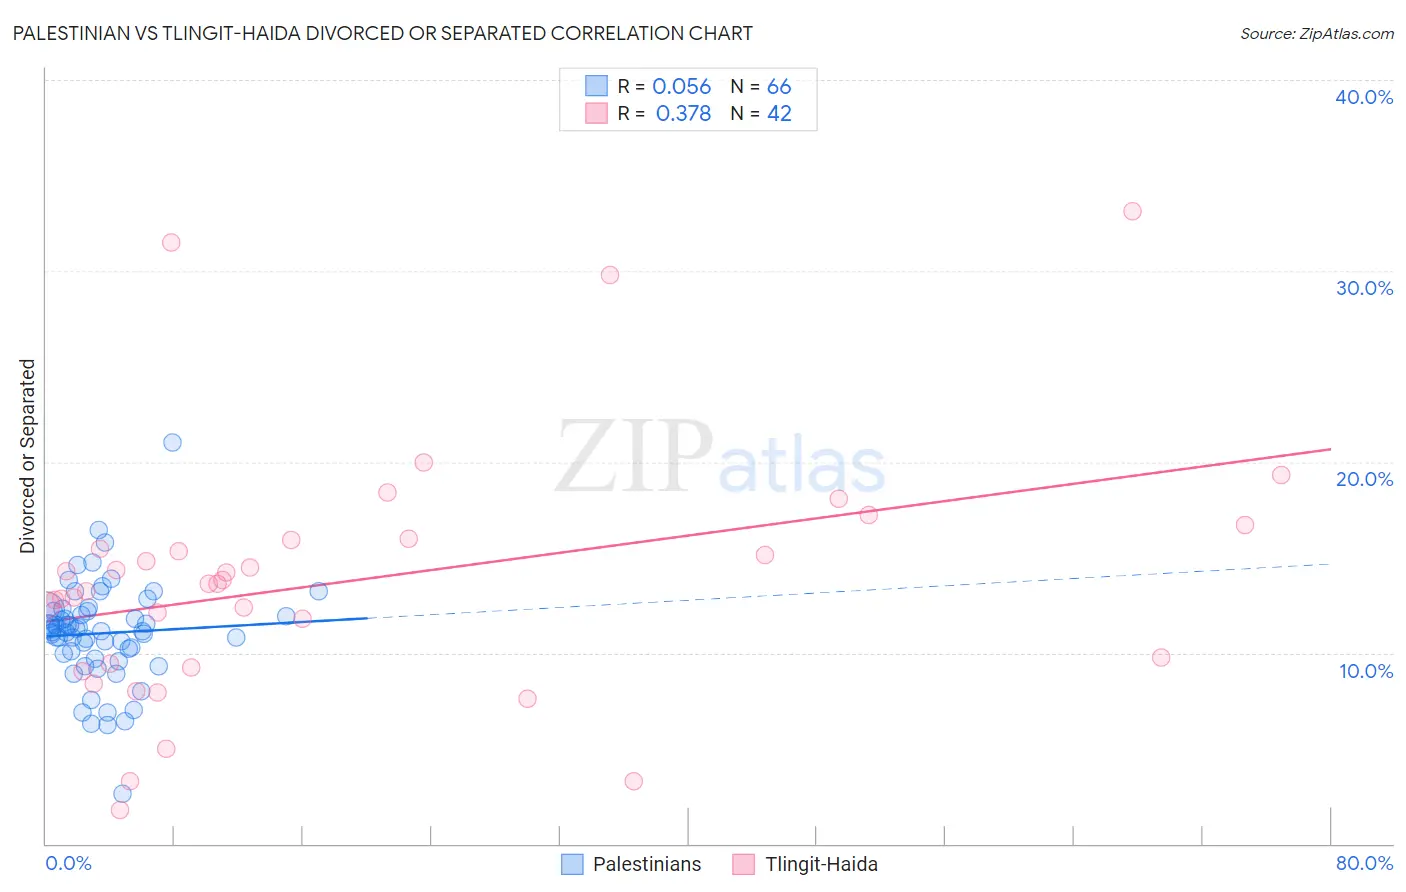
Palestinian vs Tlingit-Haida Divorced or Separated Correlation Chart
The statistical analysis conducted on geographies consisting of 216,394,525 people shows a slight positive correlation between the proportion of Palestinians and percentage of population currently divorced or separated in the United States with a correlation coefficient (R) of 0.056 and weighted average of 11.5%. Similarly, the statistical analysis conducted on geographies consisting of 60,872,098 people shows a mild positive correlation between the proportion of Tlingit-Haida and percentage of population currently divorced or separated in the United States with a correlation coefficient (R) of 0.378 and weighted average of 13.2%, a difference of 15.2%.
Divorced or Separated Correlation Summary
| Measurement | Palestinian | Tlingit-Haida |
| Minimum | 2.6% | 1.8% |
| Maximum | 21.0% | 33.1% |
| Range | 18.4% | 31.3% |
| Mean | 11.0% | 13.8% |
| Median | 11.1% | 13.6% |
| Interquartile 25% (IQ1) | 9.9% | 9.4% |
| Interquartile 75% (IQ3) | 12.2% | 15.9% |
| Interquartile Range (IQR) | 2.3% | 6.5% |
| Standard Deviation (Sample) | 2.7% | 6.6% |
| Standard Deviation (Population) | 2.7% | 6.5% |
Similar Demographics by Divorced or Separated
Demographics Similar to Palestinians by Divorced or Separated
In terms of divorced or separated, the demographic groups most similar to Palestinians are Immigrants from Belgium (11.5%, a difference of 0.0%), Immigrants from Eastern Europe (11.5%, a difference of 0.020%), Immigrants from Syria (11.4%, a difference of 0.11%), Paraguayan (11.5%, a difference of 0.12%), and Jordanian (11.5%, a difference of 0.18%).
| Demographics | Rating | Rank | Divorced or Separated |
| Koreans | 99.9 /100 | #61 | Exceptional 11.3% |
| Luxembourgers | 99.9 /100 | #62 | Exceptional 11.3% |
| Immigrants | Kuwait | 99.9 /100 | #63 | Exceptional 11.3% |
| Macedonians | 99.8 /100 | #64 | Exceptional 11.4% |
| Immigrants | South Eastern Asia | 99.8 /100 | #65 | Exceptional 11.4% |
| Inupiat | 99.8 /100 | #66 | Exceptional 11.4% |
| Immigrants | Syria | 99.7 /100 | #67 | Exceptional 11.4% |
| Palestinians | 99.7 /100 | #68 | Exceptional 11.5% |
| Immigrants | Belgium | 99.7 /100 | #69 | Exceptional 11.5% |
| Immigrants | Eastern Europe | 99.7 /100 | #70 | Exceptional 11.5% |
| Paraguayans | 99.7 /100 | #71 | Exceptional 11.5% |
| Jordanians | 99.6 /100 | #72 | Exceptional 11.5% |
| Immigrants | North Macedonia | 99.6 /100 | #73 | Exceptional 11.5% |
| Taiwanese | 99.6 /100 | #74 | Exceptional 11.5% |
| Immigrants | Northern Africa | 99.6 /100 | #75 | Exceptional 11.5% |
Demographics Similar to Tlingit-Haida by Divorced or Separated
In terms of divorced or separated, the demographic groups most similar to Tlingit-Haida are Chippewa (13.2%, a difference of 0.16%), Hopi (13.2%, a difference of 0.22%), French American Indian (13.2%, a difference of 0.25%), Ottawa (13.2%, a difference of 0.34%), and Cape Verdean (13.1%, a difference of 0.35%).
| Demographics | Rating | Rank | Divorced or Separated |
| Immigrants | Jamaica | 0.0 /100 | #299 | Tragic 13.0% |
| Immigrants | Cabo Verde | 0.0 /100 | #300 | Tragic 13.1% |
| Alaskan Athabascans | 0.0 /100 | #301 | Tragic 13.1% |
| Immigrants | Venezuela | 0.0 /100 | #302 | Tragic 13.1% |
| Cape Verdeans | 0.0 /100 | #303 | Tragic 13.1% |
| Hopi | 0.0 /100 | #304 | Tragic 13.2% |
| Chippewa | 0.0 /100 | #305 | Tragic 13.2% |
| Tlingit-Haida | 0.0 /100 | #306 | Tragic 13.2% |
| French American Indians | 0.0 /100 | #307 | Tragic 13.2% |
| Ottawa | 0.0 /100 | #308 | Tragic 13.2% |
| Americans | 0.0 /100 | #309 | Tragic 13.2% |
| Africans | 0.0 /100 | #310 | Tragic 13.2% |
| Sioux | 0.0 /100 | #311 | Tragic 13.2% |
| Blackfeet | 0.0 /100 | #312 | Tragic 13.3% |
| Immigrants | Nicaragua | 0.0 /100 | #313 | Tragic 13.3% |