Ghanaian vs Tlingit-Haida Divorced or Separated
COMPARE
Ghanaian
Tlingit-Haida
Divorced or Separated
Divorced or Separated Comparison
Ghanaians
Tlingit-Haida
12.1%
DIVORCED OR SEPARATED
45.9/ 100
METRIC RATING
178th/ 347
METRIC RANK
13.2%
DIVORCED OR SEPARATED
0.0/ 100
METRIC RATING
306th/ 347
METRIC RANK
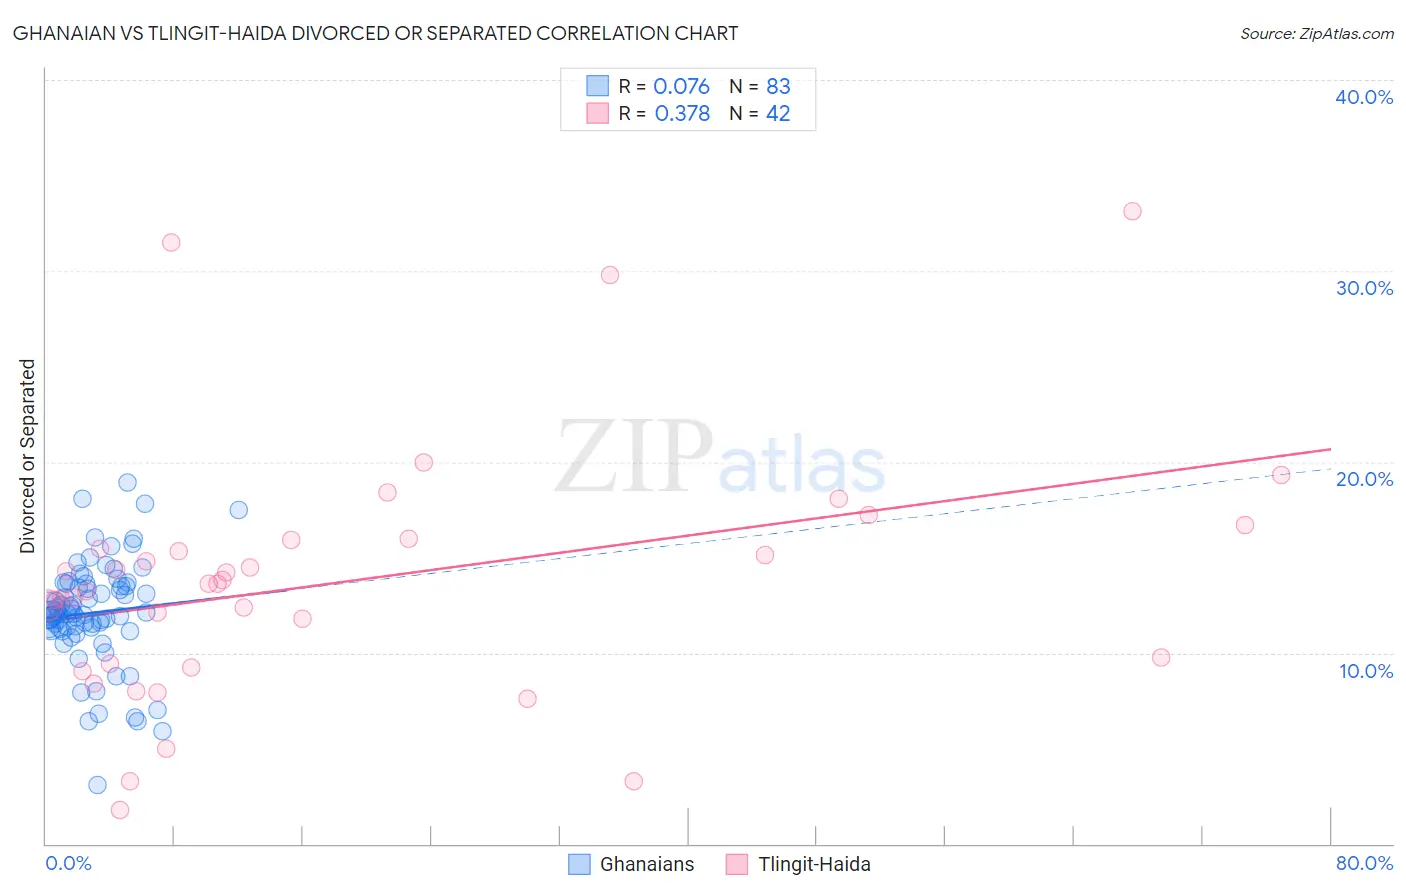
Ghanaian vs Tlingit-Haida Divorced or Separated Correlation Chart
The statistical analysis conducted on geographies consisting of 190,579,884 people shows a slight positive correlation between the proportion of Ghanaians and percentage of population currently divorced or separated in the United States with a correlation coefficient (R) of 0.076 and weighted average of 12.1%. Similarly, the statistical analysis conducted on geographies consisting of 60,872,098 people shows a mild positive correlation between the proportion of Tlingit-Haida and percentage of population currently divorced or separated in the United States with a correlation coefficient (R) of 0.378 and weighted average of 13.2%, a difference of 9.2%.
Divorced or Separated Correlation Summary
| Measurement | Ghanaian | Tlingit-Haida |
| Minimum | 3.1% | 1.8% |
| Maximum | 18.9% | 33.1% |
| Range | 15.8% | 31.3% |
| Mean | 12.1% | 13.8% |
| Median | 12.1% | 13.6% |
| Interquartile 25% (IQ1) | 11.3% | 9.4% |
| Interquartile 75% (IQ3) | 13.6% | 15.9% |
| Interquartile Range (IQR) | 2.3% | 6.5% |
| Standard Deviation (Sample) | 2.7% | 6.6% |
| Standard Deviation (Population) | 2.7% | 6.5% |
Similar Demographics by Divorced or Separated
Demographics Similar to Ghanaians by Divorced or Separated
In terms of divorced or separated, the demographic groups most similar to Ghanaians are Immigrants from Western Europe (12.1%, a difference of 0.010%), Barbadian (12.1%, a difference of 0.030%), Brazilian (12.1%, a difference of 0.060%), Immigrants from Canada (12.1%, a difference of 0.060%), and Immigrants from Ethiopia (12.1%, a difference of 0.10%).
| Demographics | Rating | Rank | Divorced or Separated |
| Costa Ricans | 53.3 /100 | #171 | Average 12.0% |
| Immigrants | Mexico | 53.2 /100 | #172 | Average 12.0% |
| Immigrants | Moldova | 50.4 /100 | #173 | Average 12.1% |
| Hawaiians | 50.0 /100 | #174 | Average 12.1% |
| Immigrants | Sierra Leone | 50.0 /100 | #175 | Average 12.1% |
| Pennsylvania Germans | 48.9 /100 | #176 | Average 12.1% |
| Brazilians | 47.7 /100 | #177 | Average 12.1% |
| Ghanaians | 45.9 /100 | #178 | Average 12.1% |
| Immigrants | Western Europe | 45.6 /100 | #179 | Average 12.1% |
| Barbadians | 45.0 /100 | #180 | Average 12.1% |
| Immigrants | Canada | 44.0 /100 | #181 | Average 12.1% |
| Immigrants | Ethiopia | 43.1 /100 | #182 | Average 12.1% |
| Immigrants | Central America | 42.9 /100 | #183 | Average 12.1% |
| Immigrants | North America | 41.1 /100 | #184 | Average 12.1% |
| Immigrants | Nigeria | 40.5 /100 | #185 | Average 12.1% |
Demographics Similar to Tlingit-Haida by Divorced or Separated
In terms of divorced or separated, the demographic groups most similar to Tlingit-Haida are Chippewa (13.2%, a difference of 0.16%), Hopi (13.2%, a difference of 0.22%), French American Indian (13.2%, a difference of 0.25%), Ottawa (13.2%, a difference of 0.34%), and Cape Verdean (13.1%, a difference of 0.35%).
| Demographics | Rating | Rank | Divorced or Separated |
| Immigrants | Jamaica | 0.0 /100 | #299 | Tragic 13.0% |
| Immigrants | Cabo Verde | 0.0 /100 | #300 | Tragic 13.1% |
| Alaskan Athabascans | 0.0 /100 | #301 | Tragic 13.1% |
| Immigrants | Venezuela | 0.0 /100 | #302 | Tragic 13.1% |
| Cape Verdeans | 0.0 /100 | #303 | Tragic 13.1% |
| Hopi | 0.0 /100 | #304 | Tragic 13.2% |
| Chippewa | 0.0 /100 | #305 | Tragic 13.2% |
| Tlingit-Haida | 0.0 /100 | #306 | Tragic 13.2% |
| French American Indians | 0.0 /100 | #307 | Tragic 13.2% |
| Ottawa | 0.0 /100 | #308 | Tragic 13.2% |
| Americans | 0.0 /100 | #309 | Tragic 13.2% |
| Africans | 0.0 /100 | #310 | Tragic 13.2% |
| Sioux | 0.0 /100 | #311 | Tragic 13.2% |
| Blackfeet | 0.0 /100 | #312 | Tragic 13.3% |
| Immigrants | Nicaragua | 0.0 /100 | #313 | Tragic 13.3% |