Immigrants from Russia vs Tlingit-Haida Unemployment Among Ages 55 to 59 years
COMPARE
Immigrants from Russia
Tlingit-Haida
Unemployment Among Ages 55 to 59 years
Unemployment Among Ages 55 to 59 years Comparison
Immigrants from Russia
Tlingit-Haida
4.9%
UNEMPLOYMENT AMONG AGES 55 TO 59 YEARS
23.7/ 100
METRIC RATING
199th/ 347
METRIC RANK
5.7%
UNEMPLOYMENT AMONG AGES 55 TO 59 YEARS
0.0/ 100
METRIC RATING
314th/ 347
METRIC RANK
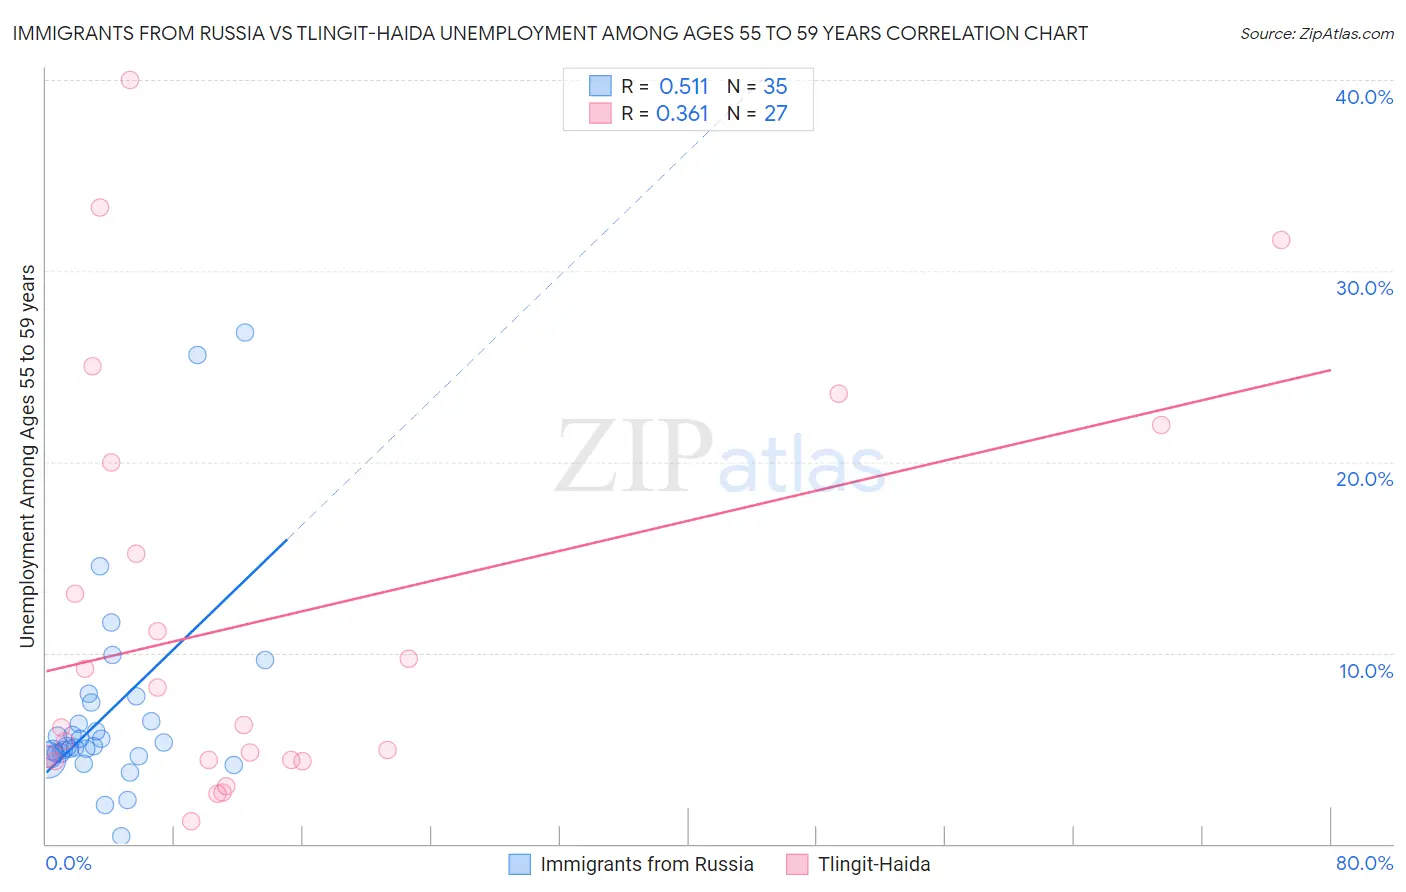
Immigrants from Russia vs Tlingit-Haida Unemployment Among Ages 55 to 59 years Correlation Chart
The statistical analysis conducted on geographies consisting of 327,176,898 people shows a substantial positive correlation between the proportion of Immigrants from Russia and unemployment rate among population between the ages 55 and 59 in the United States with a correlation coefficient (R) of 0.511 and weighted average of 4.9%. Similarly, the statistical analysis conducted on geographies consisting of 58,839,053 people shows a mild positive correlation between the proportion of Tlingit-Haida and unemployment rate among population between the ages 55 and 59 in the United States with a correlation coefficient (R) of 0.361 and weighted average of 5.7%, a difference of 16.1%.
Unemployment Among Ages 55 to 59 years Correlation Summary
| Measurement | Immigrants from Russia | Tlingit-Haida |
| Minimum | 0.40% | 1.2% |
| Maximum | 26.8% | 40.0% |
| Range | 26.4% | 38.8% |
| Mean | 6.9% | 11.9% |
| Median | 5.1% | 6.2% |
| Interquartile 25% (IQ1) | 4.6% | 4.4% |
| Interquartile 75% (IQ3) | 7.4% | 20.0% |
| Interquartile Range (IQR) | 2.8% | 15.6% |
| Standard Deviation (Sample) | 5.5% | 10.7% |
| Standard Deviation (Population) | 5.4% | 10.5% |
Similar Demographics by Unemployment Among Ages 55 to 59 years
Demographics Similar to Immigrants from Russia by Unemployment Among Ages 55 to 59 years
In terms of unemployment among ages 55 to 59 years, the demographic groups most similar to Immigrants from Russia are Basque (4.9%, a difference of 0.020%), Immigrants from South America (4.9%, a difference of 0.030%), Lumbee (4.9%, a difference of 0.070%), Immigrants from Philippines (4.9%, a difference of 0.13%), and Macedonian (4.9%, a difference of 0.15%).
| Demographics | Rating | Rank | Unemployment Among Ages 55 to 59 years |
| Immigrants | Ukraine | 31.7 /100 | #192 | Fair 4.9% |
| Immigrants | Italy | 30.1 /100 | #193 | Fair 4.9% |
| Spaniards | 27.2 /100 | #194 | Fair 4.9% |
| Estonians | 27.2 /100 | #195 | Fair 4.9% |
| Eastern Europeans | 26.7 /100 | #196 | Fair 4.9% |
| Macedonians | 26.4 /100 | #197 | Fair 4.9% |
| Immigrants | Philippines | 26.1 /100 | #198 | Fair 4.9% |
| Immigrants | Russia | 23.7 /100 | #199 | Fair 4.9% |
| Basques | 23.3 /100 | #200 | Fair 4.9% |
| Immigrants | South America | 23.1 /100 | #201 | Fair 4.9% |
| Lumbee | 22.5 /100 | #202 | Fair 4.9% |
| Guamanians/Chamorros | 20.8 /100 | #203 | Fair 4.9% |
| Immigrants | Latvia | 18.5 /100 | #204 | Poor 4.9% |
| Haitians | 18.1 /100 | #205 | Poor 4.9% |
| Immigrants | Belarus | 14.1 /100 | #206 | Poor 4.9% |
Demographics Similar to Tlingit-Haida by Unemployment Among Ages 55 to 59 years
In terms of unemployment among ages 55 to 59 years, the demographic groups most similar to Tlingit-Haida are Guyanese (5.7%, a difference of 0.15%), Central American Indian (5.6%, a difference of 0.29%), Immigrants from Ecuador (5.7%, a difference of 0.34%), Ecuadorian (5.6%, a difference of 0.48%), and Hmong (5.7%, a difference of 0.57%).
| Demographics | Rating | Rank | Unemployment Among Ages 55 to 59 years |
| Immigrants | Belize | 0.0 /100 | #307 | Tragic 5.5% |
| Spanish American Indians | 0.0 /100 | #308 | Tragic 5.6% |
| Nepalese | 0.0 /100 | #309 | Tragic 5.6% |
| Belizeans | 0.0 /100 | #310 | Tragic 5.6% |
| Houma | 0.0 /100 | #311 | Tragic 5.6% |
| Ecuadorians | 0.0 /100 | #312 | Tragic 5.6% |
| Central American Indians | 0.0 /100 | #313 | Tragic 5.6% |
| Tlingit-Haida | 0.0 /100 | #314 | Tragic 5.7% |
| Guyanese | 0.0 /100 | #315 | Tragic 5.7% |
| Immigrants | Ecuador | 0.0 /100 | #316 | Tragic 5.7% |
| Hmong | 0.0 /100 | #317 | Tragic 5.7% |
| Immigrants | Guyana | 0.0 /100 | #318 | Tragic 5.8% |
| Kiowa | 0.0 /100 | #319 | Tragic 5.8% |
| Immigrants | Azores | 0.0 /100 | #320 | Tragic 5.8% |
| Chippewa | 0.0 /100 | #321 | Tragic 5.9% |