Immigrants from Guatemala vs Tlingit-Haida Divorced or Separated
COMPARE
Immigrants from Guatemala
Tlingit-Haida
Divorced or Separated
Divorced or Separated Comparison
Immigrants from Guatemala
Tlingit-Haida
12.2%
DIVORCED OR SEPARATED
23.2/ 100
METRIC RATING
203rd/ 347
METRIC RANK
13.2%
DIVORCED OR SEPARATED
0.0/ 100
METRIC RATING
306th/ 347
METRIC RANK
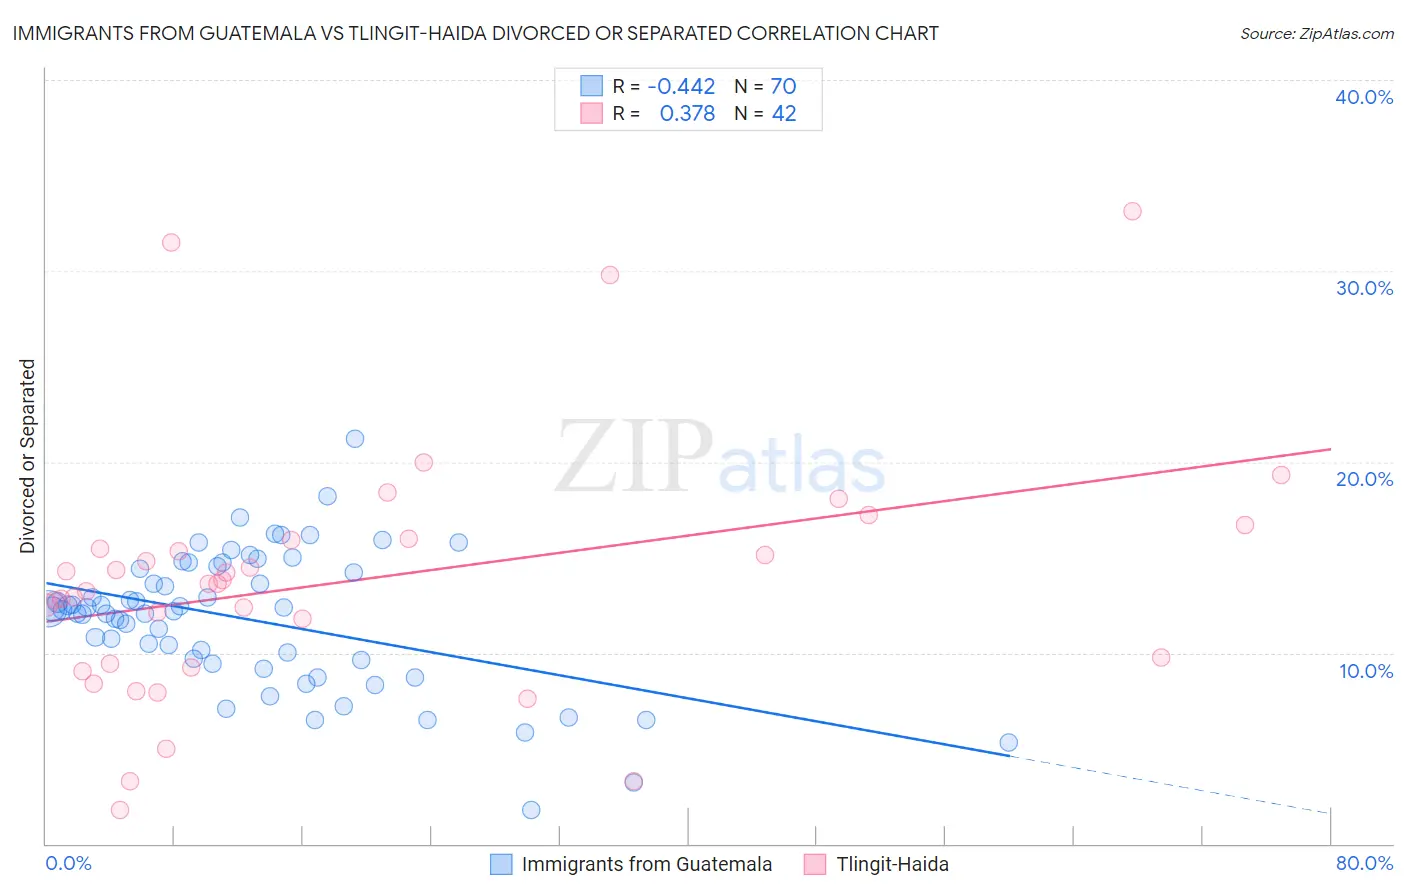
Immigrants from Guatemala vs Tlingit-Haida Divorced or Separated Correlation Chart
The statistical analysis conducted on geographies consisting of 377,229,357 people shows a moderate negative correlation between the proportion of Immigrants from Guatemala and percentage of population currently divorced or separated in the United States with a correlation coefficient (R) of -0.442 and weighted average of 12.2%. Similarly, the statistical analysis conducted on geographies consisting of 60,872,098 people shows a mild positive correlation between the proportion of Tlingit-Haida and percentage of population currently divorced or separated in the United States with a correlation coefficient (R) of 0.378 and weighted average of 13.2%, a difference of 8.2%.
Divorced or Separated Correlation Summary
| Measurement | Immigrants from Guatemala | Tlingit-Haida |
| Minimum | 1.8% | 1.8% |
| Maximum | 21.2% | 33.1% |
| Range | 19.4% | 31.3% |
| Mean | 11.7% | 13.8% |
| Median | 12.3% | 13.6% |
| Interquartile 25% (IQ1) | 9.6% | 9.4% |
| Interquartile 75% (IQ3) | 14.4% | 15.9% |
| Interquartile Range (IQR) | 4.8% | 6.5% |
| Standard Deviation (Sample) | 3.6% | 6.6% |
| Standard Deviation (Population) | 3.5% | 6.5% |
Similar Demographics by Divorced or Separated
Demographics Similar to Immigrants from Guatemala by Divorced or Separated
In terms of divorced or separated, the demographic groups most similar to Immigrants from Guatemala are Portuguese (12.2%, a difference of 0.020%), Kenyan (12.2%, a difference of 0.070%), Immigrants from Costa Rica (12.2%, a difference of 0.10%), Slovak (12.2%, a difference of 0.11%), and Mexican (12.2%, a difference of 0.11%).
| Demographics | Rating | Rank | Divorced or Separated |
| Immigrants | Burma/Myanmar | 30.4 /100 | #196 | Fair 12.1% |
| Immigrants | Africa | 30.3 /100 | #197 | Fair 12.1% |
| Nigerians | 30.1 /100 | #198 | Fair 12.1% |
| Central Americans | 29.4 /100 | #199 | Fair 12.1% |
| South Americans | 28.6 /100 | #200 | Fair 12.2% |
| Guatemalans | 26.9 /100 | #201 | Fair 12.2% |
| Portuguese | 23.5 /100 | #202 | Fair 12.2% |
| Immigrants | Guatemala | 23.2 /100 | #203 | Fair 12.2% |
| Kenyans | 21.8 /100 | #204 | Fair 12.2% |
| Immigrants | Costa Rica | 21.3 /100 | #205 | Fair 12.2% |
| Slovaks | 21.0 /100 | #206 | Fair 12.2% |
| Mexicans | 21.0 /100 | #207 | Fair 12.2% |
| Immigrants | Ghana | 18.8 /100 | #208 | Poor 12.2% |
| Immigrants | Trinidad and Tobago | 17.8 /100 | #209 | Poor 12.2% |
| Slavs | 17.0 /100 | #210 | Poor 12.2% |
Demographics Similar to Tlingit-Haida by Divorced or Separated
In terms of divorced or separated, the demographic groups most similar to Tlingit-Haida are Chippewa (13.2%, a difference of 0.16%), Hopi (13.2%, a difference of 0.22%), French American Indian (13.2%, a difference of 0.25%), Ottawa (13.2%, a difference of 0.34%), and Cape Verdean (13.1%, a difference of 0.35%).
| Demographics | Rating | Rank | Divorced or Separated |
| Immigrants | Jamaica | 0.0 /100 | #299 | Tragic 13.0% |
| Immigrants | Cabo Verde | 0.0 /100 | #300 | Tragic 13.1% |
| Alaskan Athabascans | 0.0 /100 | #301 | Tragic 13.1% |
| Immigrants | Venezuela | 0.0 /100 | #302 | Tragic 13.1% |
| Cape Verdeans | 0.0 /100 | #303 | Tragic 13.1% |
| Hopi | 0.0 /100 | #304 | Tragic 13.2% |
| Chippewa | 0.0 /100 | #305 | Tragic 13.2% |
| Tlingit-Haida | 0.0 /100 | #306 | Tragic 13.2% |
| French American Indians | 0.0 /100 | #307 | Tragic 13.2% |
| Ottawa | 0.0 /100 | #308 | Tragic 13.2% |
| Americans | 0.0 /100 | #309 | Tragic 13.2% |
| Africans | 0.0 /100 | #310 | Tragic 13.2% |
| Sioux | 0.0 /100 | #311 | Tragic 13.2% |
| Blackfeet | 0.0 /100 | #312 | Tragic 13.3% |
| Immigrants | Nicaragua | 0.0 /100 | #313 | Tragic 13.3% |