Immigrants from Portugal vs Iranian Average Family Size
COMPARE
Immigrants from Portugal
Iranian
Average Family Size
Average Family Size Comparison
Immigrants from Portugal
Iranians
3.18
AVERAGE FAMILY SIZE
4.2/ 100
METRIC RATING
236th/ 347
METRIC RANK
3.18
AVERAGE FAMILY SIZE
4.5/ 100
METRIC RATING
234th/ 347
METRIC RANK
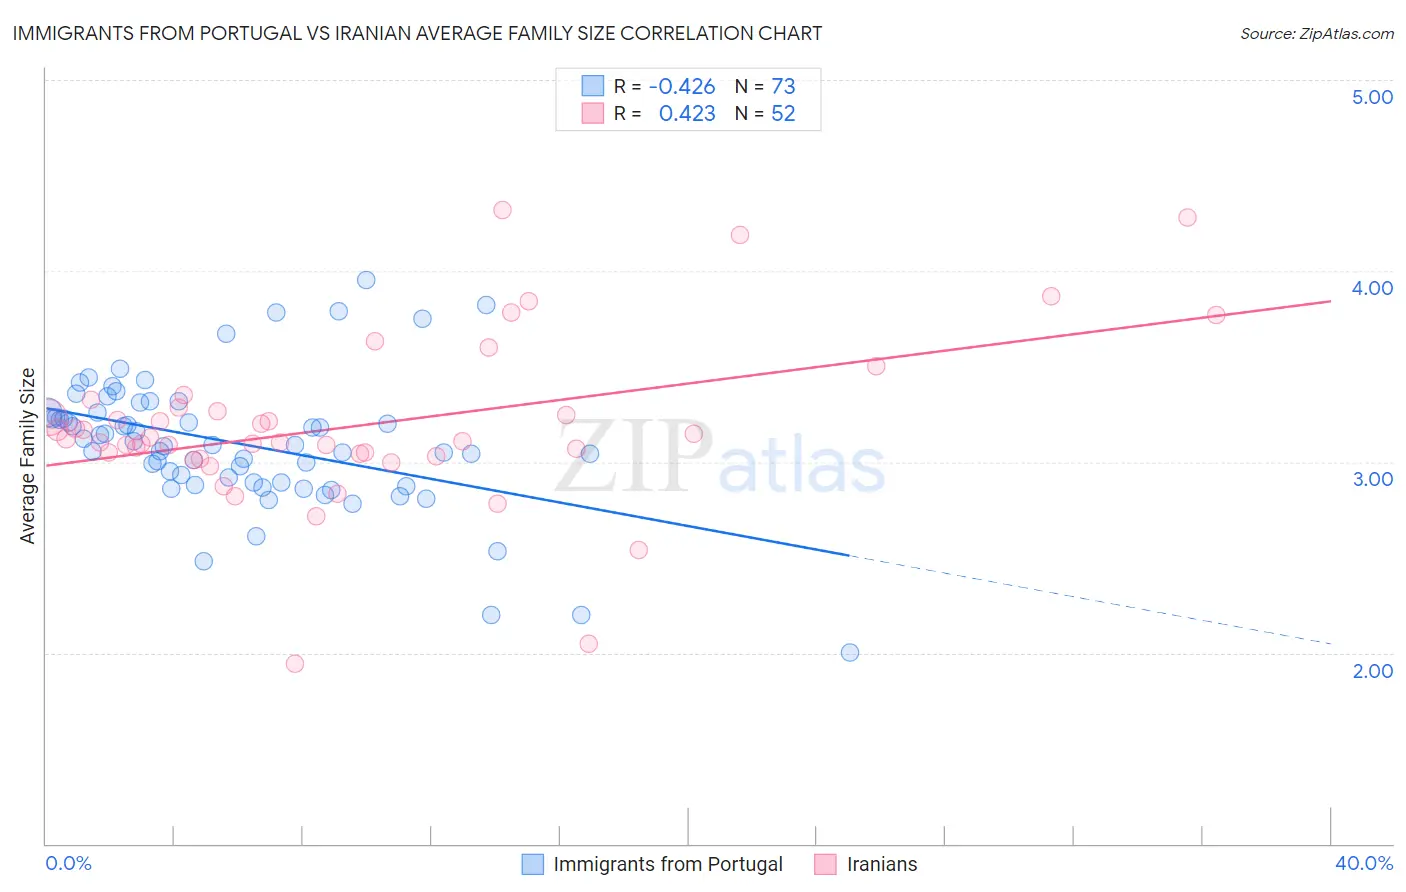
Immigrants from Portugal vs Iranian Average Family Size Correlation Chart
The statistical analysis conducted on geographies consisting of 174,766,763 people shows a moderate negative correlation between the proportion of Immigrants from Portugal and average family size in the United States with a correlation coefficient (R) of -0.426 and weighted average of 3.18. Similarly, the statistical analysis conducted on geographies consisting of 316,654,945 people shows a moderate positive correlation between the proportion of Iranians and average family size in the United States with a correlation coefficient (R) of 0.423 and weighted average of 3.18, a difference of 0.030%.
Average Family Size Correlation Summary
| Measurement | Immigrants from Portugal | Iranian |
| Minimum | 2.00 | 1.94 |
| Maximum | 3.95 | 4.32 |
| Range | 1.95 | 2.38 |
| Mean | 3.10 | 3.19 |
| Median | 3.09 | 3.12 |
| Interquartile 25% (IQ1) | 2.89 | 3.04 |
| Interquartile 75% (IQ3) | 3.26 | 3.27 |
| Interquartile Range (IQR) | 0.37 | 0.24 |
| Standard Deviation (Sample) | 0.35 | 0.44 |
| Standard Deviation (Population) | 0.35 | 0.44 |
Demographics Similar to Immigrants from Portugal and Iranians by Average Family Size
In terms of average family size, the demographic groups most similar to Immigrants from Portugal are Immigrants from Turkey (3.18, a difference of 0.010%), Brazilian (3.18, a difference of 0.040%), Immigrants from Romania (3.18, a difference of 0.050%), Romanian (3.18, a difference of 0.050%), and Cherokee (3.18, a difference of 0.060%). Similarly, the demographic groups most similar to Iranians are Brazilian (3.18, a difference of 0.0%), Immigrants from Turkey (3.18, a difference of 0.020%), Cherokee (3.18, a difference of 0.030%), Icelander (3.19, a difference of 0.070%), and Basque (3.19, a difference of 0.070%).
| Demographics | Rating | Rank | Average Family Size |
| Cree | 6.2 /100 | #225 | Tragic 3.19 |
| Chickasaw | 6.0 /100 | #226 | Tragic 3.19 |
| Portuguese | 6.0 /100 | #227 | Tragic 3.19 |
| Immigrants | Nonimmigrants | 5.7 /100 | #228 | Tragic 3.19 |
| Immigrants | Italy | 5.3 /100 | #229 | Tragic 3.19 |
| Icelanders | 5.2 /100 | #230 | Tragic 3.19 |
| Basques | 5.2 /100 | #231 | Tragic 3.19 |
| Cherokee | 4.7 /100 | #232 | Tragic 3.18 |
| Brazilians | 4.5 /100 | #233 | Tragic 3.18 |
| Iranians | 4.5 /100 | #234 | Tragic 3.18 |
| Immigrants | Turkey | 4.2 /100 | #235 | Tragic 3.18 |
| Immigrants | Portugal | 4.2 /100 | #236 | Tragic 3.18 |
| Immigrants | Romania | 3.7 /100 | #237 | Tragic 3.18 |
| Romanians | 3.7 /100 | #238 | Tragic 3.18 |
| Houma | 3.4 /100 | #239 | Tragic 3.18 |
| Osage | 3.2 /100 | #240 | Tragic 3.18 |
| Immigrants | Japan | 3.0 /100 | #241 | Tragic 3.18 |
| Hungarians | 3.0 /100 | #242 | Tragic 3.18 |
| Immigrants | Moldova | 2.9 /100 | #243 | Tragic 3.18 |
| Immigrants | Southern Europe | 2.9 /100 | #244 | Tragic 3.18 |
| Immigrants | Brazil | 2.7 /100 | #245 | Tragic 3.18 |