Immigrants from Philippines vs Colombian Family Households
COMPARE
Immigrants from Philippines
Colombian
Family Households
Family Households Comparison
Immigrants from Philippines
Colombians
68.3%
FAMILY HOUSEHOLDS
100.0/ 100
METRIC RATING
10th/ 347
METRIC RANK
66.3%
FAMILY HOUSEHOLDS
100.0/ 100
METRIC RATING
52nd/ 347
METRIC RANK
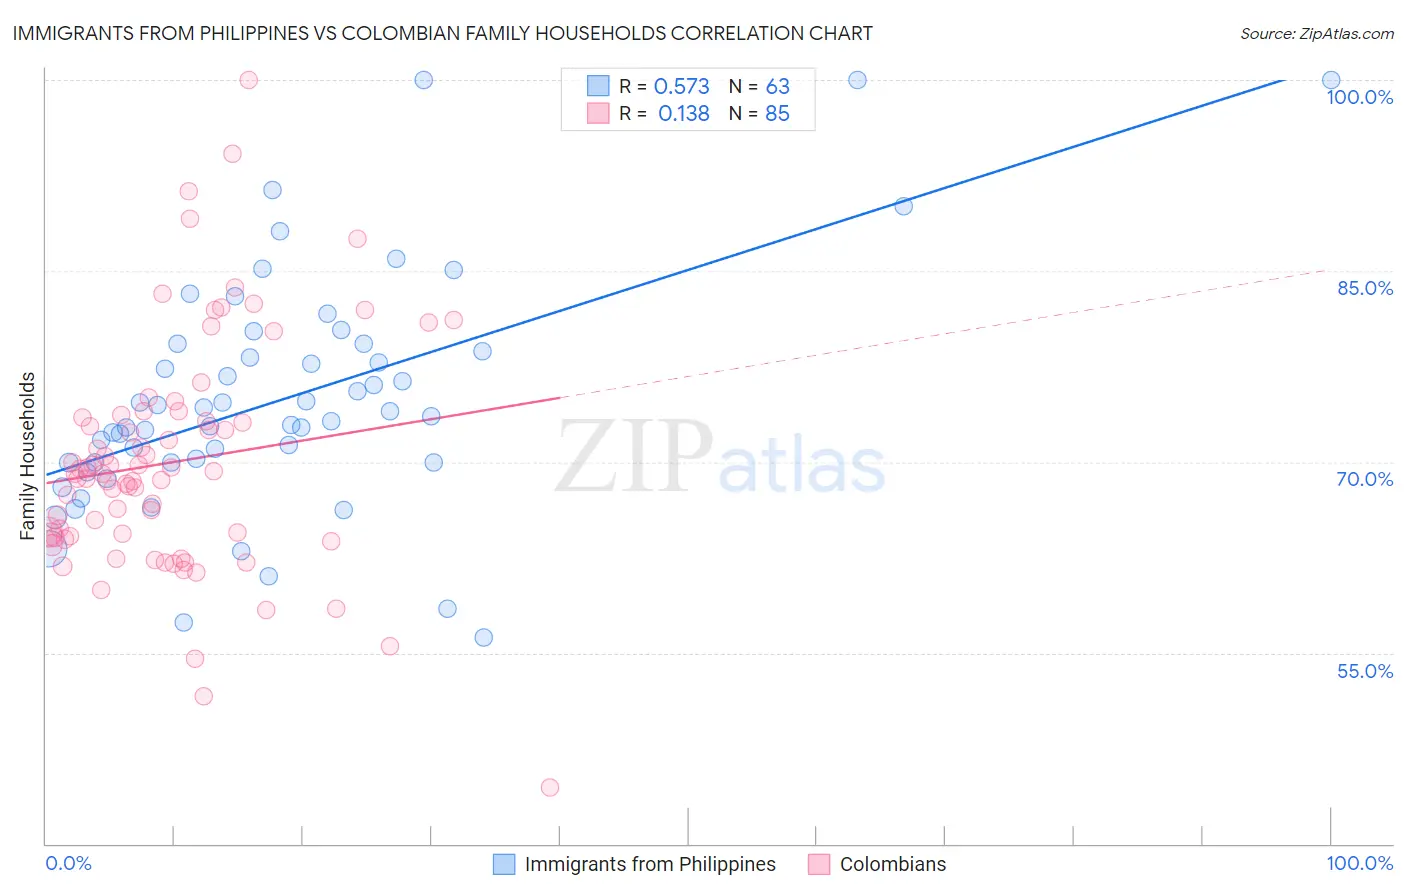
Immigrants from Philippines vs Colombian Family Households Correlation Chart
The statistical analysis conducted on geographies consisting of 471,023,329 people shows a substantial positive correlation between the proportion of Immigrants from Philippines and percentage of family households in the United States with a correlation coefficient (R) of 0.573 and weighted average of 68.3%. Similarly, the statistical analysis conducted on geographies consisting of 419,324,434 people shows a poor positive correlation between the proportion of Colombians and percentage of family households in the United States with a correlation coefficient (R) of 0.138 and weighted average of 66.3%, a difference of 3.1%.
Family Households Correlation Summary
| Measurement | Immigrants from Philippines | Colombian |
| Minimum | 56.2% | 44.4% |
| Maximum | 100.0% | 100.0% |
| Range | 43.8% | 55.6% |
| Mean | 74.9% | 70.0% |
| Median | 73.6% | 69.1% |
| Interquartile 25% (IQ1) | 69.9% | 64.1% |
| Interquartile 75% (IQ3) | 79.3% | 73.6% |
| Interquartile Range (IQR) | 9.3% | 9.5% |
| Standard Deviation (Sample) | 9.3% | 9.2% |
| Standard Deviation (Population) | 9.2% | 9.2% |
Similar Demographics by Family Households
Demographics Similar to Immigrants from Philippines by Family Households
In terms of family households, the demographic groups most similar to Immigrants from Philippines are Native Hawaiian (68.4%, a difference of 0.070%), Immigrants from Central America (68.3%, a difference of 0.070%), Korean (68.3%, a difference of 0.10%), Pueblo (68.2%, a difference of 0.18%), and Immigrants from Cuba (68.2%, a difference of 0.19%).
| Demographics | Rating | Rank | Family Households |
| Tongans | 100.0 /100 | #3 | Exceptional 69.6% |
| Yakama | 100.0 /100 | #4 | Exceptional 69.3% |
| Yuman | 100.0 /100 | #5 | Exceptional 69.3% |
| Immigrants | Mexico | 100.0 /100 | #6 | Exceptional 69.1% |
| Mexicans | 100.0 /100 | #7 | Exceptional 69.0% |
| Immigrants | Fiji | 100.0 /100 | #8 | Exceptional 68.8% |
| Native Hawaiians | 100.0 /100 | #9 | Exceptional 68.4% |
| Immigrants | Philippines | 100.0 /100 | #10 | Exceptional 68.3% |
| Immigrants | Central America | 100.0 /100 | #11 | Exceptional 68.3% |
| Koreans | 100.0 /100 | #12 | Exceptional 68.3% |
| Pueblo | 100.0 /100 | #13 | Exceptional 68.2% |
| Immigrants | Cuba | 100.0 /100 | #14 | Exceptional 68.2% |
| Assyrians/Chaldeans/Syriacs | 100.0 /100 | #15 | Exceptional 68.2% |
| Immigrants | Vietnam | 100.0 /100 | #16 | Exceptional 68.2% |
| Chinese | 100.0 /100 | #17 | Exceptional 68.1% |
Demographics Similar to Colombians by Family Households
In terms of family households, the demographic groups most similar to Colombians are Afghan (66.3%, a difference of 0.010%), Immigrants from Colombia (66.3%, a difference of 0.010%), Native/Alaskan (66.4%, a difference of 0.14%), Navajo (66.4%, a difference of 0.16%), and Immigrants (66.1%, a difference of 0.17%).
| Demographics | Rating | Rank | Family Households |
| Venezuelans | 100.0 /100 | #45 | Exceptional 66.5% |
| Arapaho | 100.0 /100 | #46 | Exceptional 66.5% |
| Bolivians | 100.0 /100 | #47 | Exceptional 66.5% |
| Immigrants | Venezuela | 100.0 /100 | #48 | Exceptional 66.4% |
| Immigrants | South Central Asia | 100.0 /100 | #49 | Exceptional 66.4% |
| Navajo | 100.0 /100 | #50 | Exceptional 66.4% |
| Natives/Alaskans | 100.0 /100 | #51 | Exceptional 66.4% |
| Colombians | 100.0 /100 | #52 | Exceptional 66.3% |
| Afghans | 100.0 /100 | #53 | Exceptional 66.3% |
| Immigrants | Colombia | 100.0 /100 | #54 | Exceptional 66.3% |
| Immigrants | Immigrants | 100.0 /100 | #55 | Exceptional 66.1% |
| Immigrants | Hong Kong | 100.0 /100 | #56 | Exceptional 66.1% |
| Pennsylvania Germans | 100.0 /100 | #57 | Exceptional 66.1% |
| Immigrants | Asia | 100.0 /100 | #58 | Exceptional 66.1% |
| Immigrants | Korea | 100.0 /100 | #59 | Exceptional 66.0% |